Sprint dashboard
The dashboard in the Execution workspace facilitates the monitoring of the test cases execution phase. When a sprint or sprint group is selected from the Execution workspace library, the first anchor displays the object's default dashboard, and it adapts to the selection.
A sprint group's dashboard displays data compiled from all the sprints within the group.
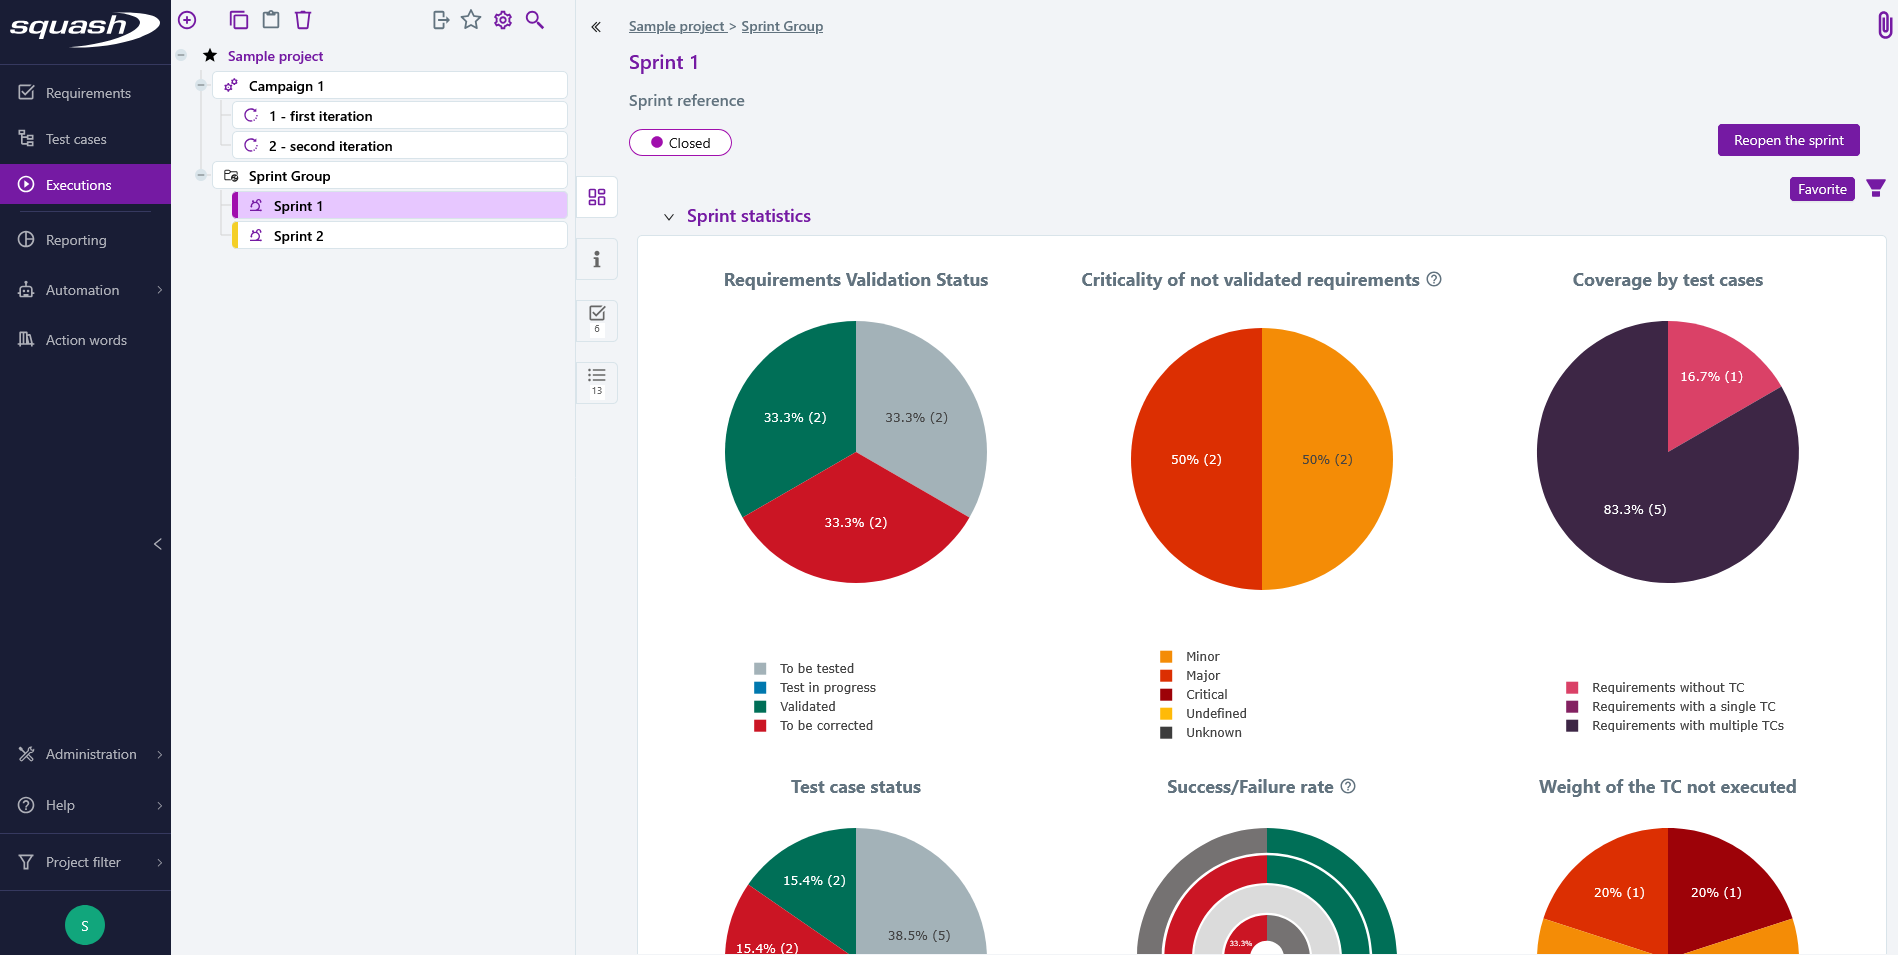
Sprint statistics
The graphs in the Sprint statistics block show the distribution of sprint requirements by validation status, the distribution of non-validated sprint requirements by requirement criticality, coverage of sprint requirements by test cases, the distribution of tests by execution status, the success or failure rate by importance of tests, and the distribution by importance of tests never executed.
The default dashboard for sprints and sprint groups contains six charts. The three charts in the top row display the progression of sprint requirements, while the three charts in the bottom row display the progression of test cases within the overall sprint execution plan.
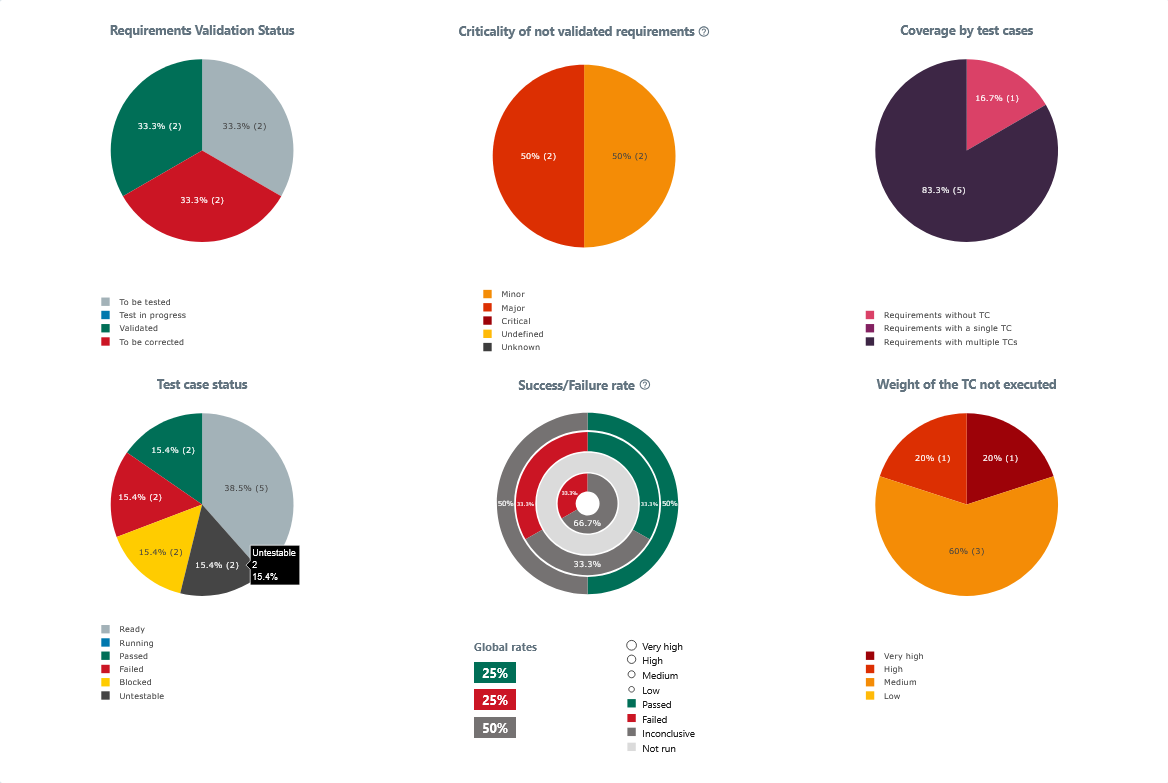
The three sprint requirement charts are as follows:
Requirements Validation Status Chart
Distribution of sprint requirements by their validation status. This chart provides an overview of the progress made in validating the sprint requirements.Criticality of Not Validated Requirements Chart
Distribution of requirements whose validation status is not Validated, categorized by their SquashTM criticality. The criticality value is taken from the requirement in the Requirements workspace. If a deleted requirement falls within the scope of the sprint, it is counted as having an Unknown criticality.
Focus
This chart is not yet available for synchronized sprints/sprint groups and is therefore only displayed on the dashboard of a manual sprint or sprint group.
- Coverage by Test Cases Chart
Distribution of requirements based on the number of test cases in their execution plan. This chart is used to verify the functional coverage of the application and to identify requirements that are not covered by any test cases.
The three charts showing test-case progression in the overall sprint execution plan match the charts found on other default dashboards in the Executions workspace:
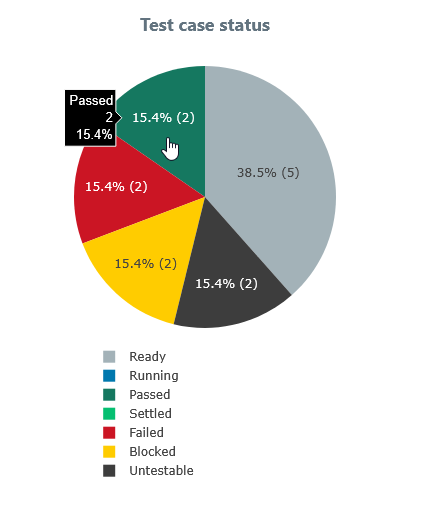
Test Case Status Chart
Distribution of tests by their execution status. This chart provides an overview of the progress of test case execution.Success/Failure rate Chart
Distribution of tests in a donut chart according to their execution status and importance. This chart provides a breakdown of success and failure rates according to test importance.Weight of the TC not executed Chart
Distribution of tests that have never been executed, categorized by their importance. This chart helps identify the importance level of tests that have never been run.
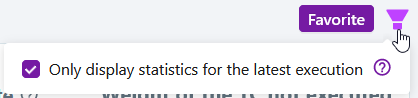
In these charts, the option Only display statistics for the latest execution allows you to visualize either:
- all the test plan items within the scope (unchecked option): for example, in a sprint with two sprint requirements, if the same test case fails in the execution plan of sprint requirement 1 and passes in the execution plan of sprint requirement 2, it will be counted twice in the charts;
- only the last test plan item corresponding to a test case - dataset pair (checked option): taking the above example, only the successful test from the execution plan of sprint requirement 2 will be counted in the charts
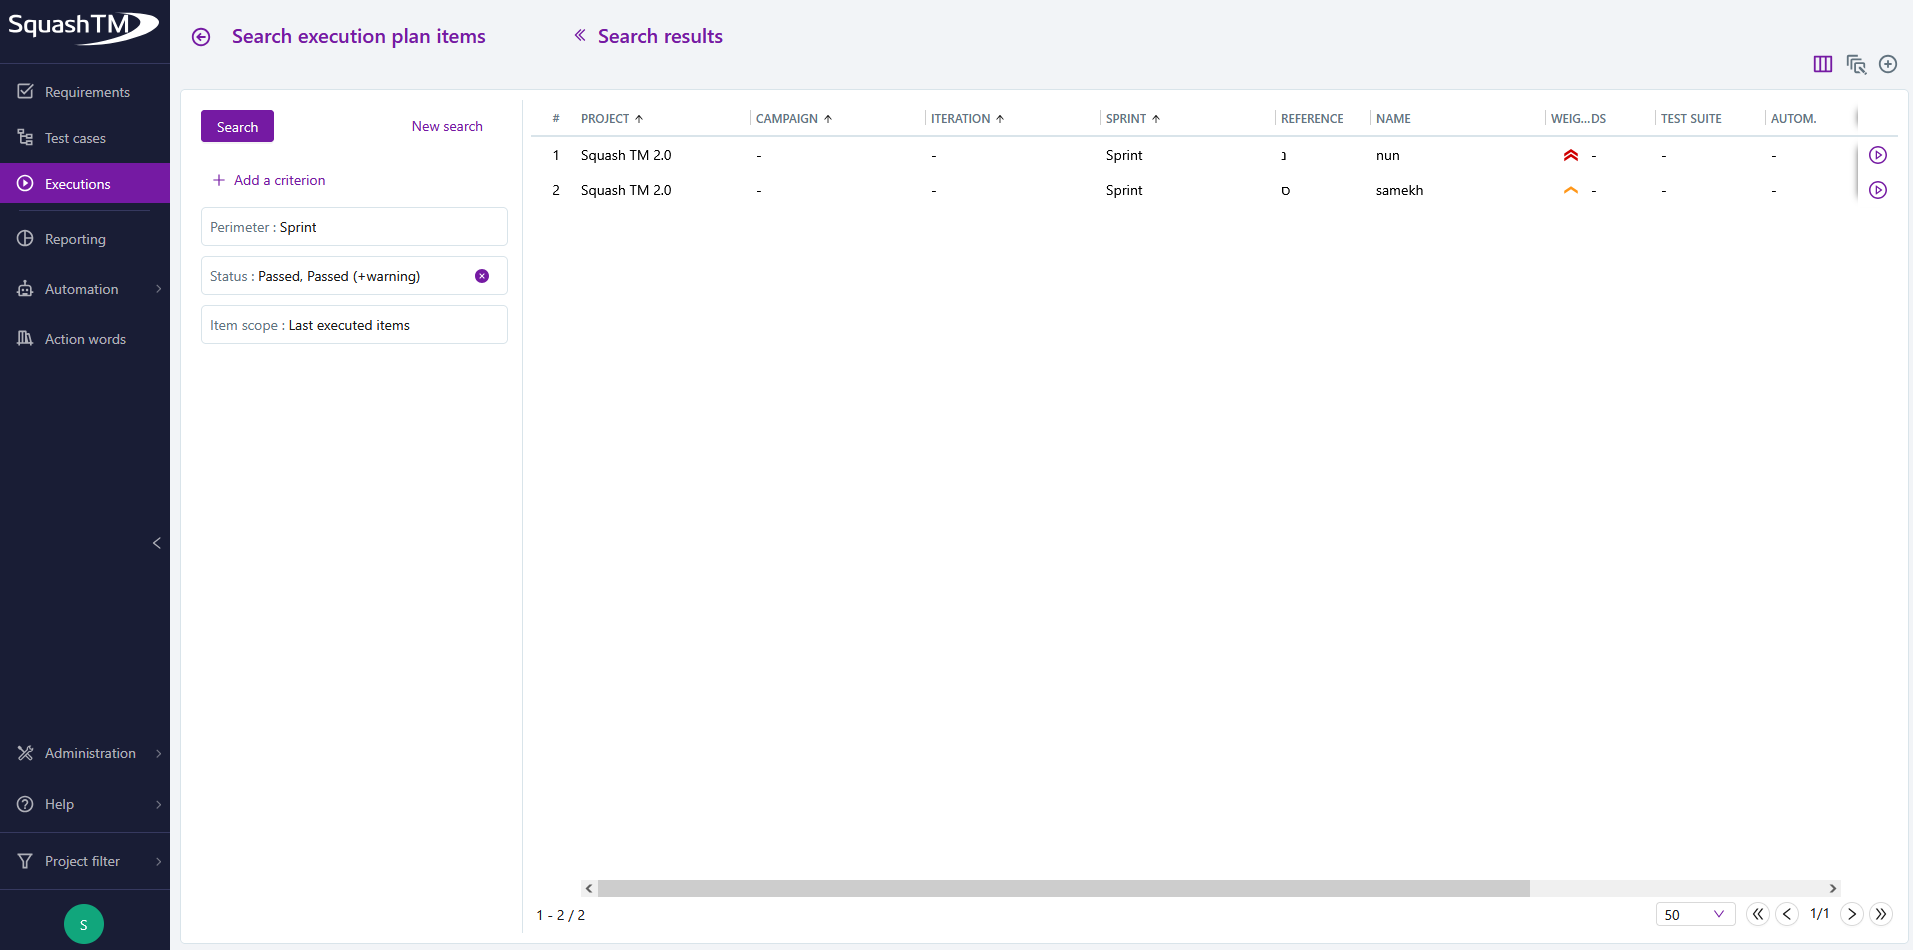
Accessing the Search Page
When clicking on a portion in the Test case status, Success/Failure rate, and Weight of the TC not executed charts, a search page appears with a preselected perimeter and search criteria matching that portion of the chart.
For example:
When clicking on the Passed test cases slice of the Test Case Status chart, a search page appears with the criteria Status: Passed, Passed (+warning).
Info
This feature is not available for custom dashboards nor sprint requirement charts.
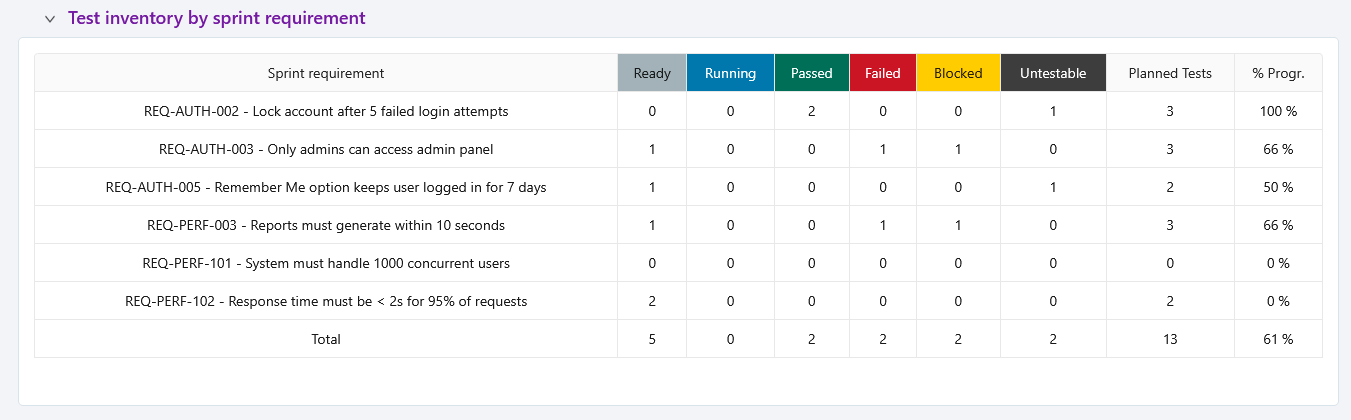
Test inventory
The Test inventory by sprint requirement block of a sprint is a distribution table counting the number of tests by execution status and by sprint requirement. For a sprint group dashboard, the tests in the inventory table are gathered by sprint rather than by sprint requirement.