View Artificial Intelligence statistics
The statistics related to Artificial Intelligence are accessible from the Statistics submenu of the Administration workspace, by clicking the Artificial Intelligence anchor  . This anchor groups the statistics related to the various uses of AI in SquashTM; for now it contains a single tab, dedicated to test case generation, but others may be added in the future.
Required license
The Statistics submenu is available with a SquashTM Ultimate license 💎 and is only accessible to users with an "Administrator" profile.
Test case generation
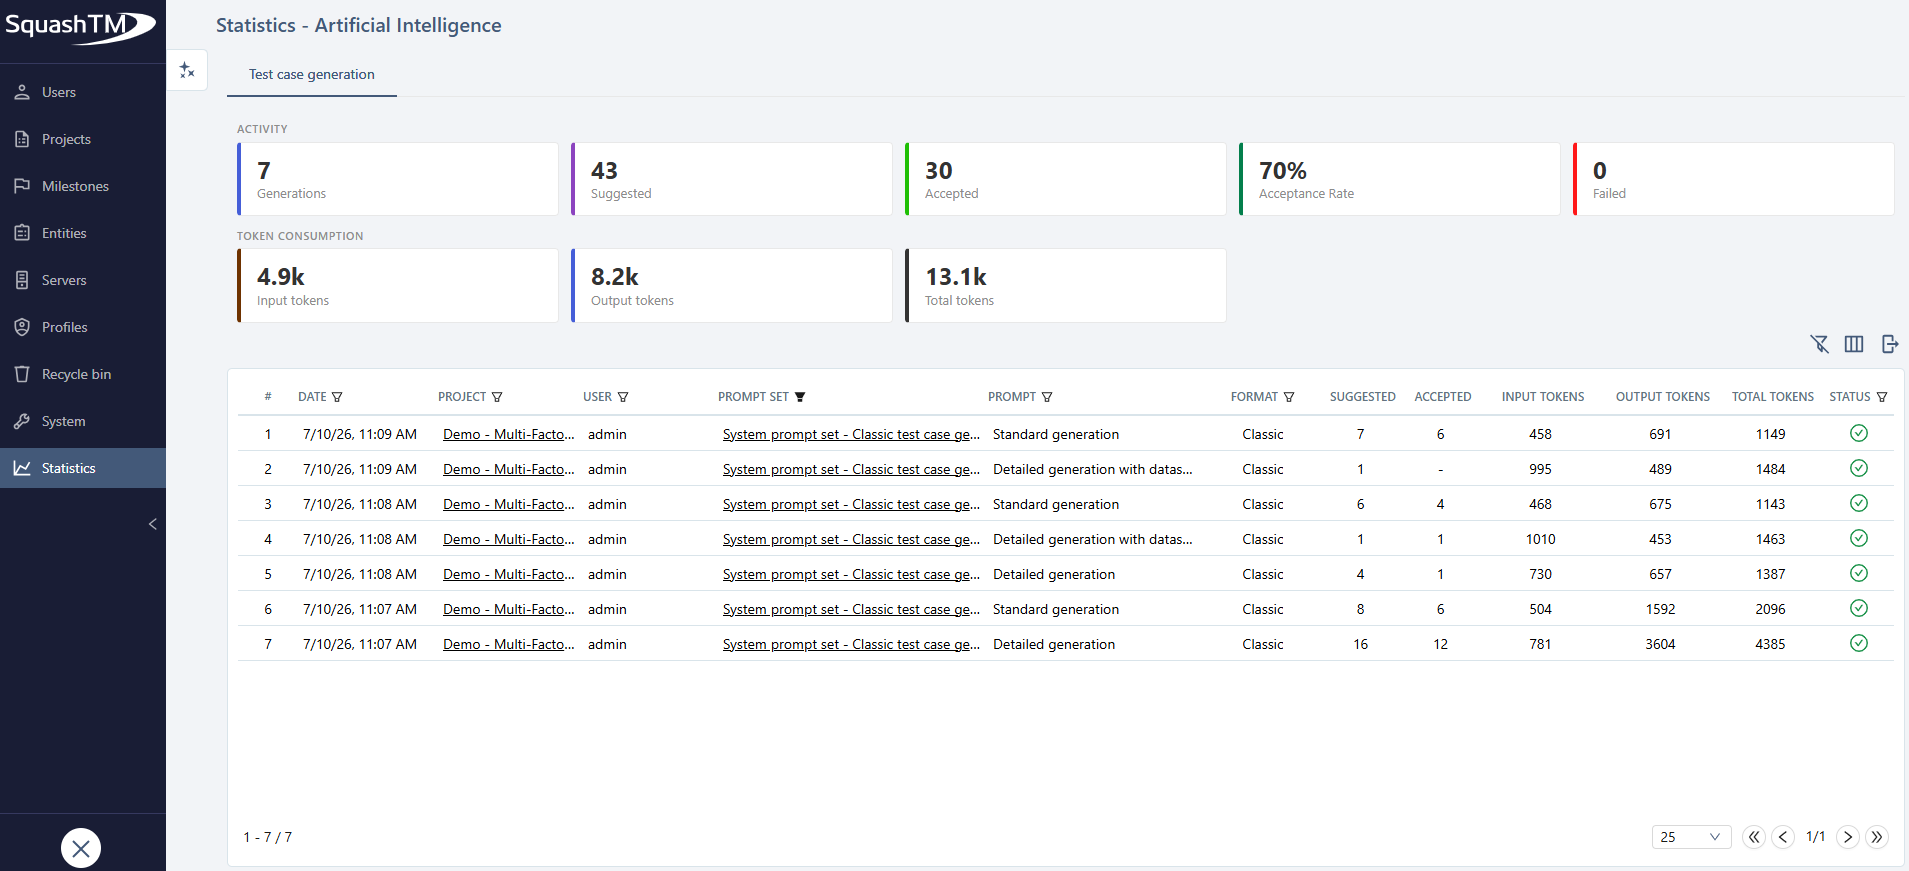
The Test case generation tab lists every generation performed on the instance. A generation corresponds to a request sent to the AI, whether it succeeds or not.
The table is sorted by default on the Date in descending order, the most recent generation appearing on the first row. The displayed columns, the sorting and filtering options are customizable; the filters applied to the table are also reflected on the summary cards.
Summary cards
The cards displayed at the top of the tab provide a quantified overview. Their values are recalculated according to the filters applied to the table; when no filter is applied, they cover all the generations of the instance.
They are grouped into two sections:
- Activity:
- Generations: total number of generations;
- Suggested: number of test cases suggested by the AI;
- Accepted: number of test cases actually kept by the testers;
- Acceptance Rate: proportion of accepted test cases among the suggested ones;
- Failed: number of failed generations;
- Token consumption:
- Input tokens: total tokens sent to the AI server;
- Output tokens: total tokens produced by the AI server;
- Total tokens: sum of the input and output tokens.
Value formatting
Beyond 1,000, token counts are abbreviated (for example 2.9k for 2,900).
Table columns
Default columns
The columns displayed by default are the following:
- the Date the generation request was sent;
- the Project from which the generation was launched: a clickable link to the project consultation page;
- the User who launched the generation;
- the Prompt set used: a clickable link to the prompt set consultation page;
- the Prompt used for the generation;
- the Format of the generated test cases;
- Suggested: number of test cases suggested by the AI;
- Accepted: number of test cases actually kept by the tester; this field remains empty as long as no test case has been saved;
- Input tokens: number of tokens sent to the AI server (prompt, source requirement, documents, requirements and test cases in context);
- Output tokens: number of tokens produced by the AI server in its response;
- Total tokens: sum of the input and output tokens;
- the Status of the generation, which indicates "Success" when the AI returned a valid response, or "Failure" in case of invalid configuration or AI server error.
Failed generations
For a "Failure" generation, no test case is suggested and no token is counted.
Customize the columns
The [Select columns] button  , located above the table, allows showing or hiding columns. The configuration is saved for each user.
In addition to the columns displayed by default, the following columns can be added:
- the AI Model used;
- the AI Provider;
- the AI Response date;
- the Finish reason returned by the AI;
- the Total suggested steps across all generated test cases;
- the User message length;
- the Number of context documents;
- the Number of context requirements;
- the Number of context test cases.
Export the statistics
The [Export statistics] button  , located above the table, allows exporting the generations in Excel format (
.xlsx). The export takes into account the applied filters and sorting, and contains the columns currently displayed in the table. To export an additional piece of data (model, provider, context counters…), you must first display it via the [Select columns] button.
Going further
- Generate test cases: the user journey that feeds this table.
- Manage prompt sets: the prompt sets and prompts referenced in the table's columns.