Analyze the results
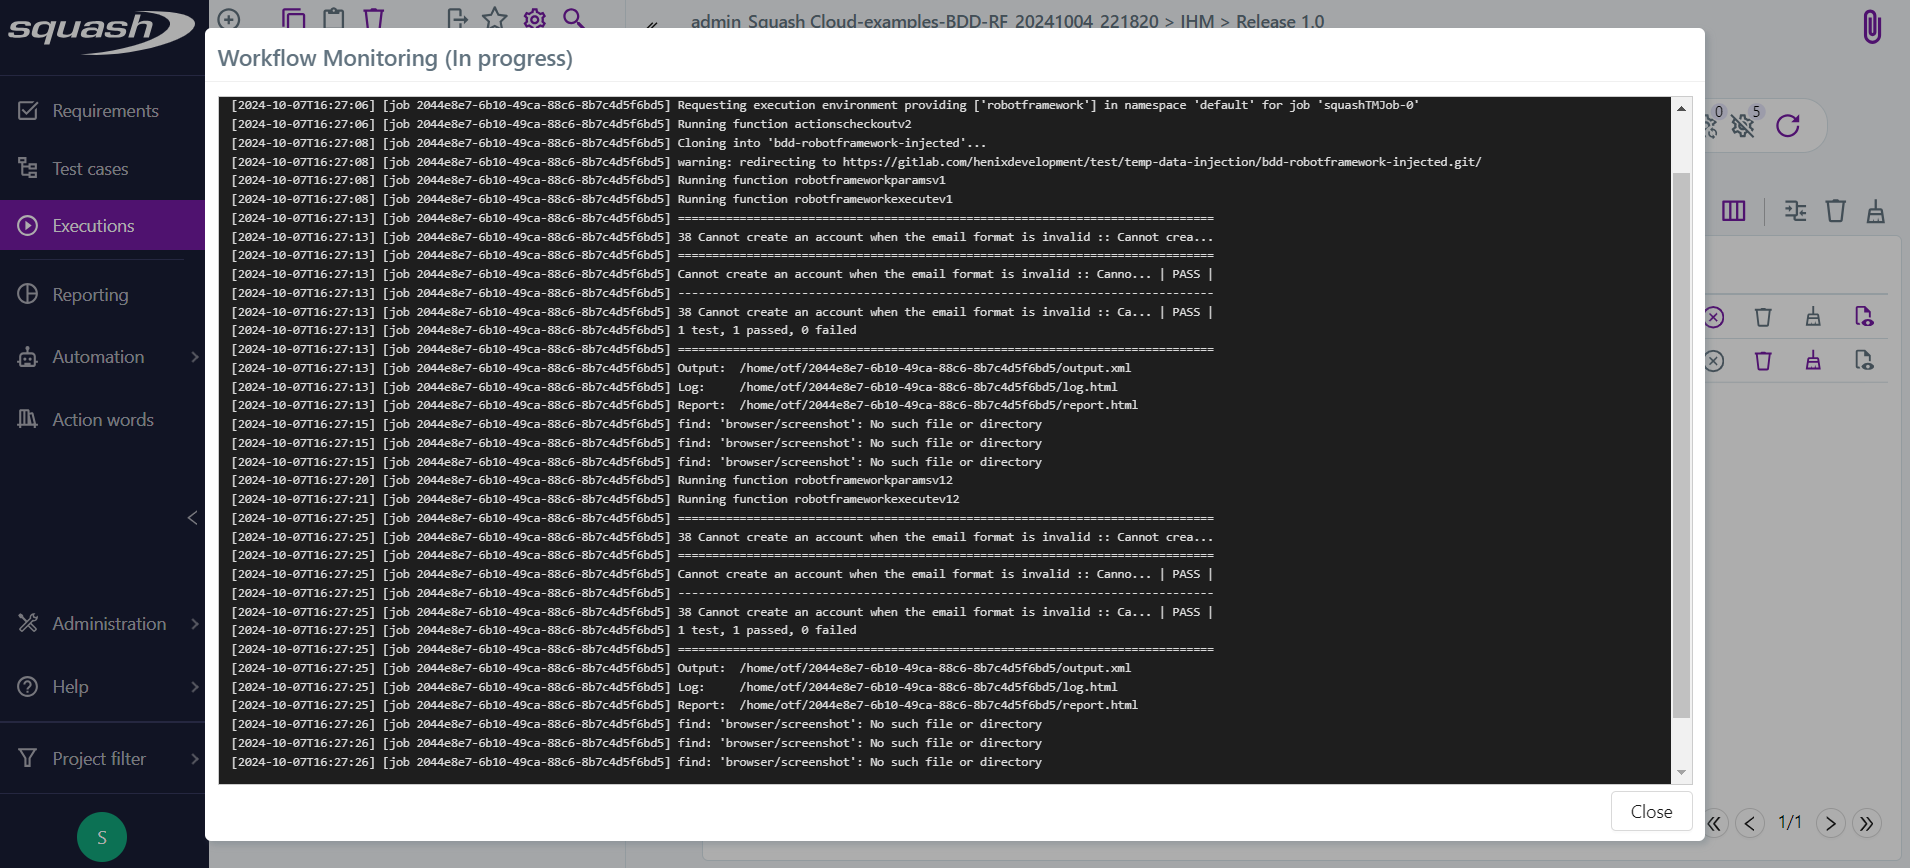
Real-Time Execution Log Monitoring
Warning
The real-time execution log visualization from the Squash TM interface is available only with a Squash Premium or Ultimate license, along with the Squash TM Premium plugin.
It is possible to monitor the workflow logs in real-time for automated tests executed from the Squash interface by clicking on the icon ![]() associated with an automated suite.
associated with an automated suite.
For an automated suite containing a single workflow, the log visualization window opens automatically:
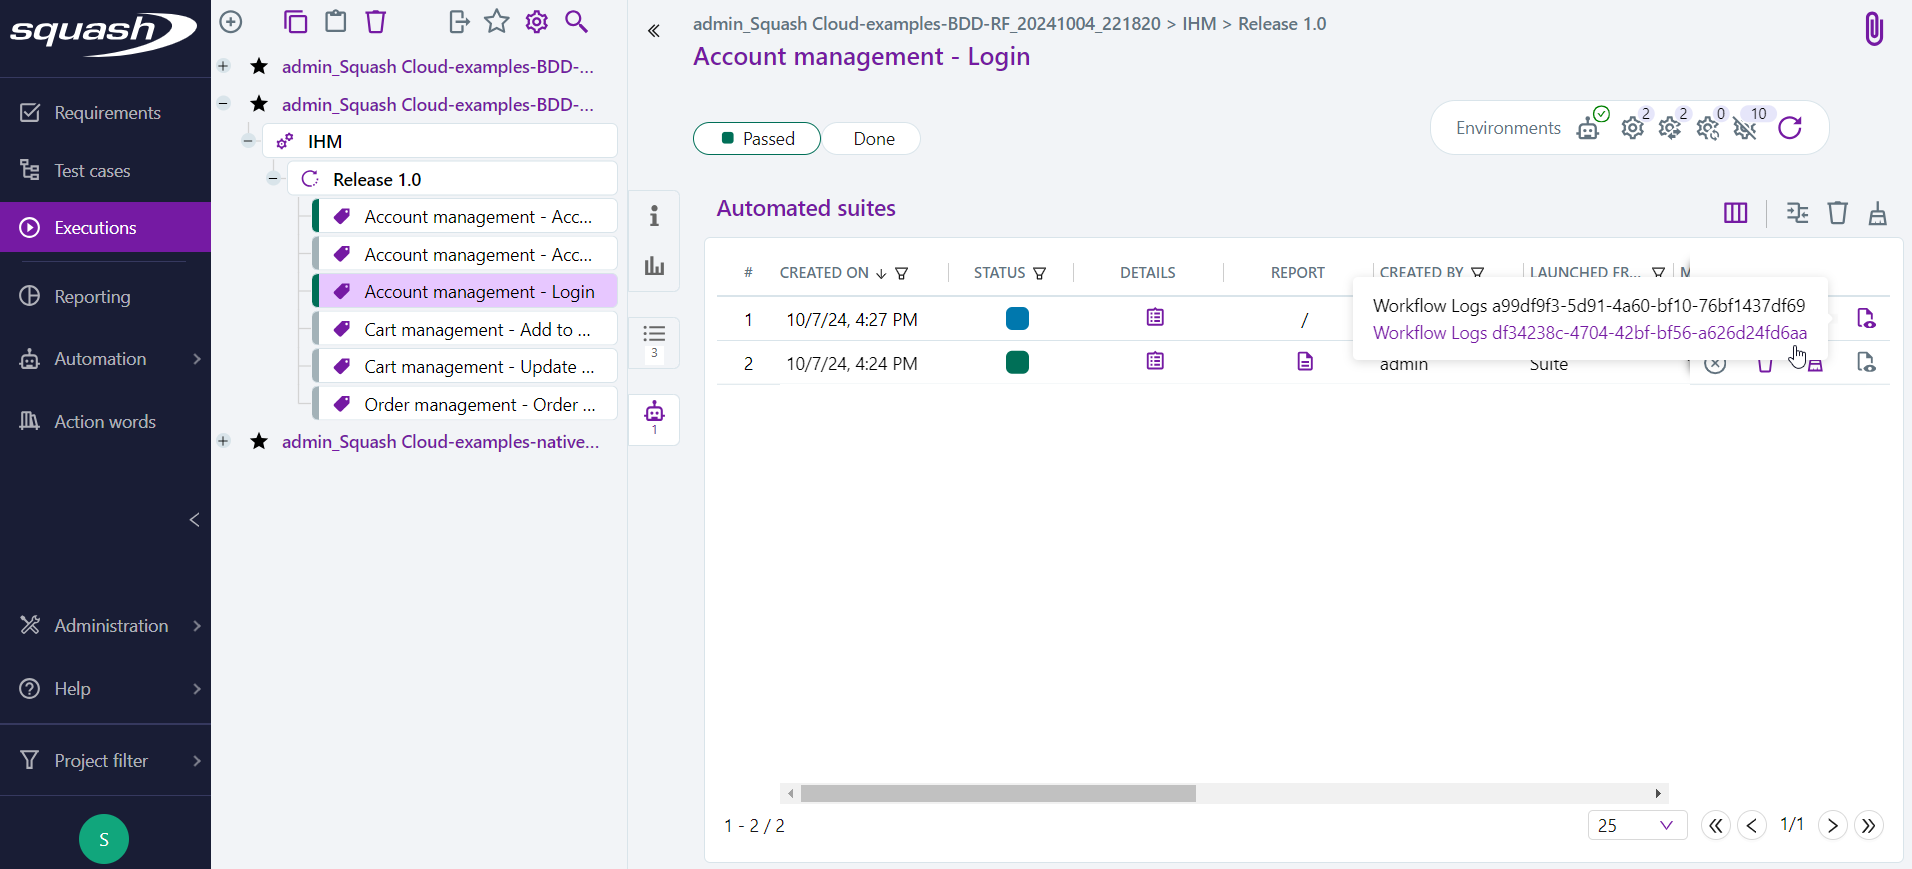
For an automated suite containing multiple workflows, a menu appears listing the available workflows, allowing you to select the one for which you want to view the logs:
Publication of the results of an execution plan
During the execution of a test plan (from Squash TM or from a CI/CD pipeline):
- A new execution is created for each test plan item, see the Squash TM glossary) as each test is executed. It has a status corresponding to the result of the automated test:
Success,Failure, orBlocked. Execution reports and attachments for the automated test are available from the Automated suites tab.

- When all tests in the automated suite have been executed, the status of this one is updated.
An HTML report (executionreport.html), an Allure format report (allure-report.tar), and the logs of Squash Orchestrator (executionlog.txt) for all executed tests are available from the Automated suites tab.
For more information on how to use the Allure report, please refer to the Allure documentation.

Deprecation of Allure reports
Since the 2024-03 release, Squash Orchestrator can generate a HTML report giving a full overview of the tests of a workflow. This is the same as for Allure reports, but the Orchestrator ones are more versatile and will be further expandable in the future. As a result, we plan to deprecate the support of Allure reports:
- With the 2024-10 delivery, the Orchestrator stops generating Allure reports by default. The generation is reactivable via configuration, using
OPENTF_ALLURE_ENABLEDenvironment variable: see the OpenTestFactory documentation for details. - Q3 2025, the support of Allure reports will be dropped. No Allure report will be creatable anymore.
Reports and attachments for the different executions are also accessible from the Execution screen (they are present in the attached files).
Execution Status of Executions and Automated Suites
| Squash Status | Color | Execution | Automated Suite |
|---|---|---|---|
| Ready |  | The test plan item is part of an automated suite that has been launched, but the corresponding automated script has not yet started. | - |
| Running |  | The item is running. | The automated suite has been launched. |
| Passed |  | The item has been executed and its result (as reported by the test framework) is 'passed'. | All items in the automated suite have been executed and have a status 'passed' or 'skipped'. |
| Failed |  | The item has been executed and its result (as reported by the test framework) is 'failed'. | All items in the automated suite have been executed, none have a status 'blocked', and at least one item has a status 'failed'. |
| Blocked |  | The item could not be executed or its results could not be analyzed: the test does not exist, a library/dependency/… is missing, the Surefire report was not generated… | All items in the automated suite have been executed, at least one item has a status 'blocked'. |
| Skipped * |  | The item was not executed or has a status 'skipped' (i.e., it was marked in the automated test code as not to be executed). | All items in the automated suite have been executed and have a status 'skipped'. |
| Cancelled |  | The item will never be launched because the orchestrator's workflow was deliberately interrupted by a user in the meantime. | The automated suite was cancelled before all the items in the automated suite were executed. |
* The 'Skipped' status currently exists only for Cucumber and Robot Framework.
Squash Orchestrator automated suites
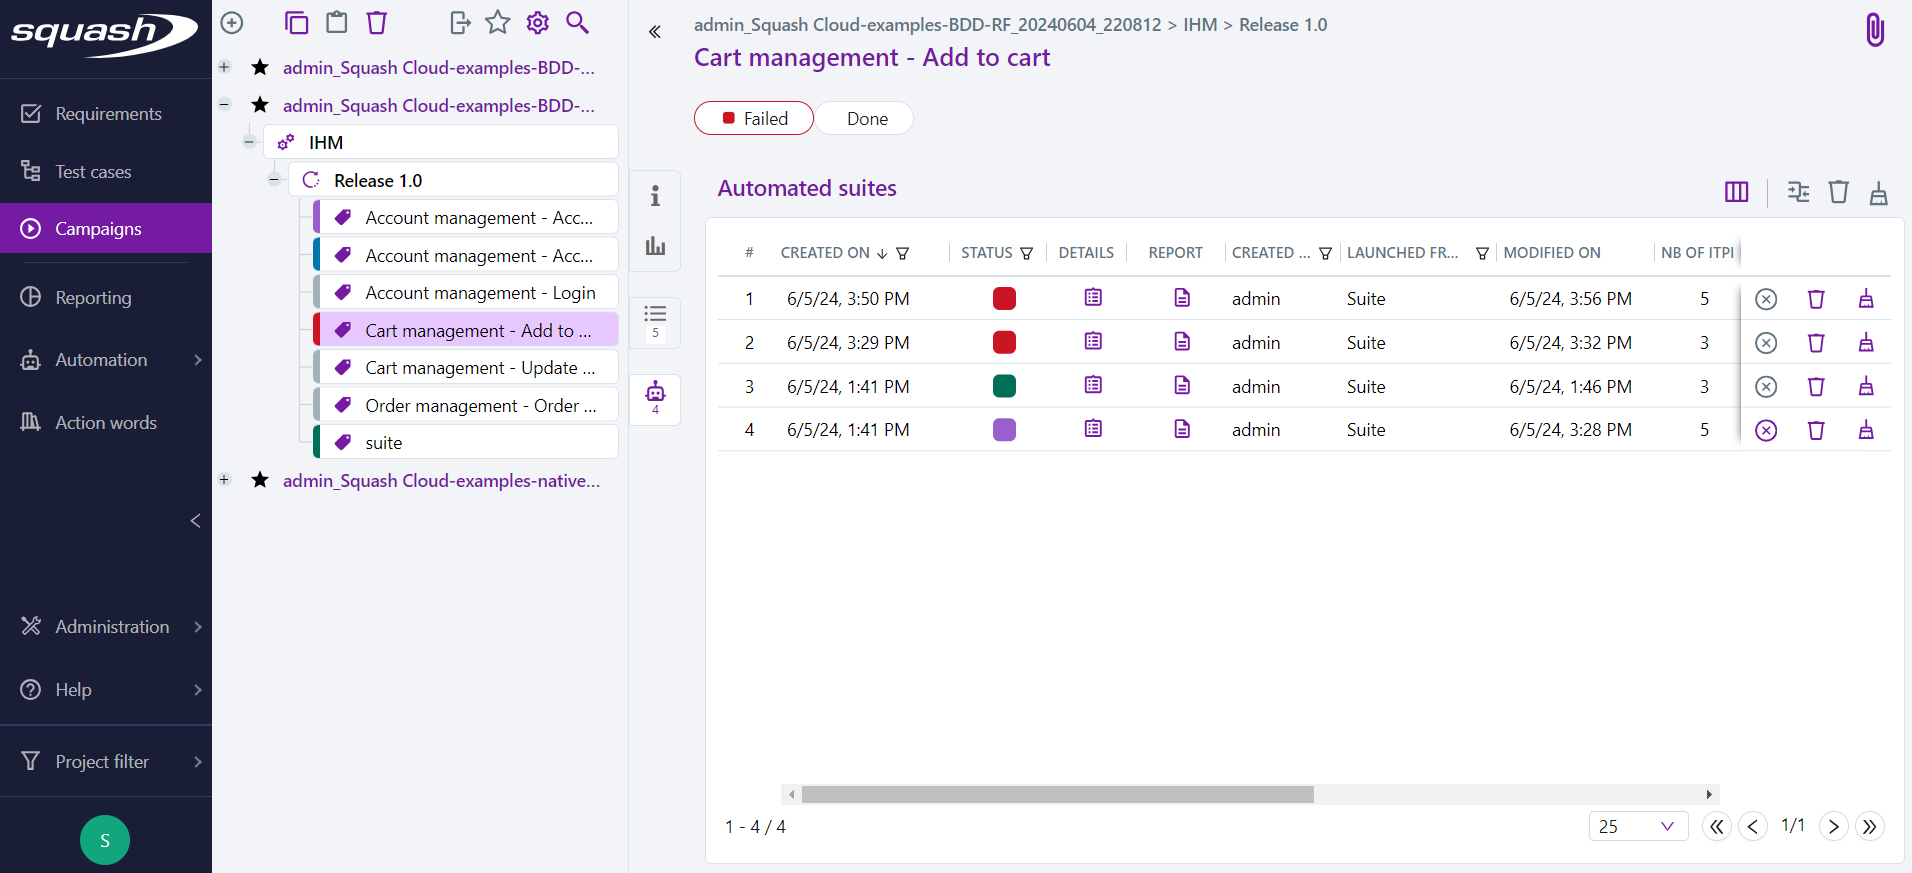
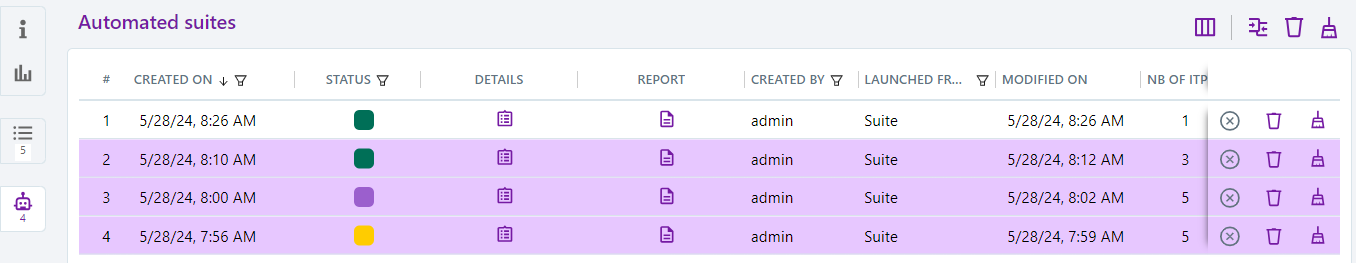
From the Automated Suites anchor of an iteration or a test suite, you can view the list of automated suites.
For each automated suite, the following informations are available:
- creation date;
- status of the automated suite ('Passed', 'Failed', 'Cancelled', 'Blocked', 'Running', 'Skipped');
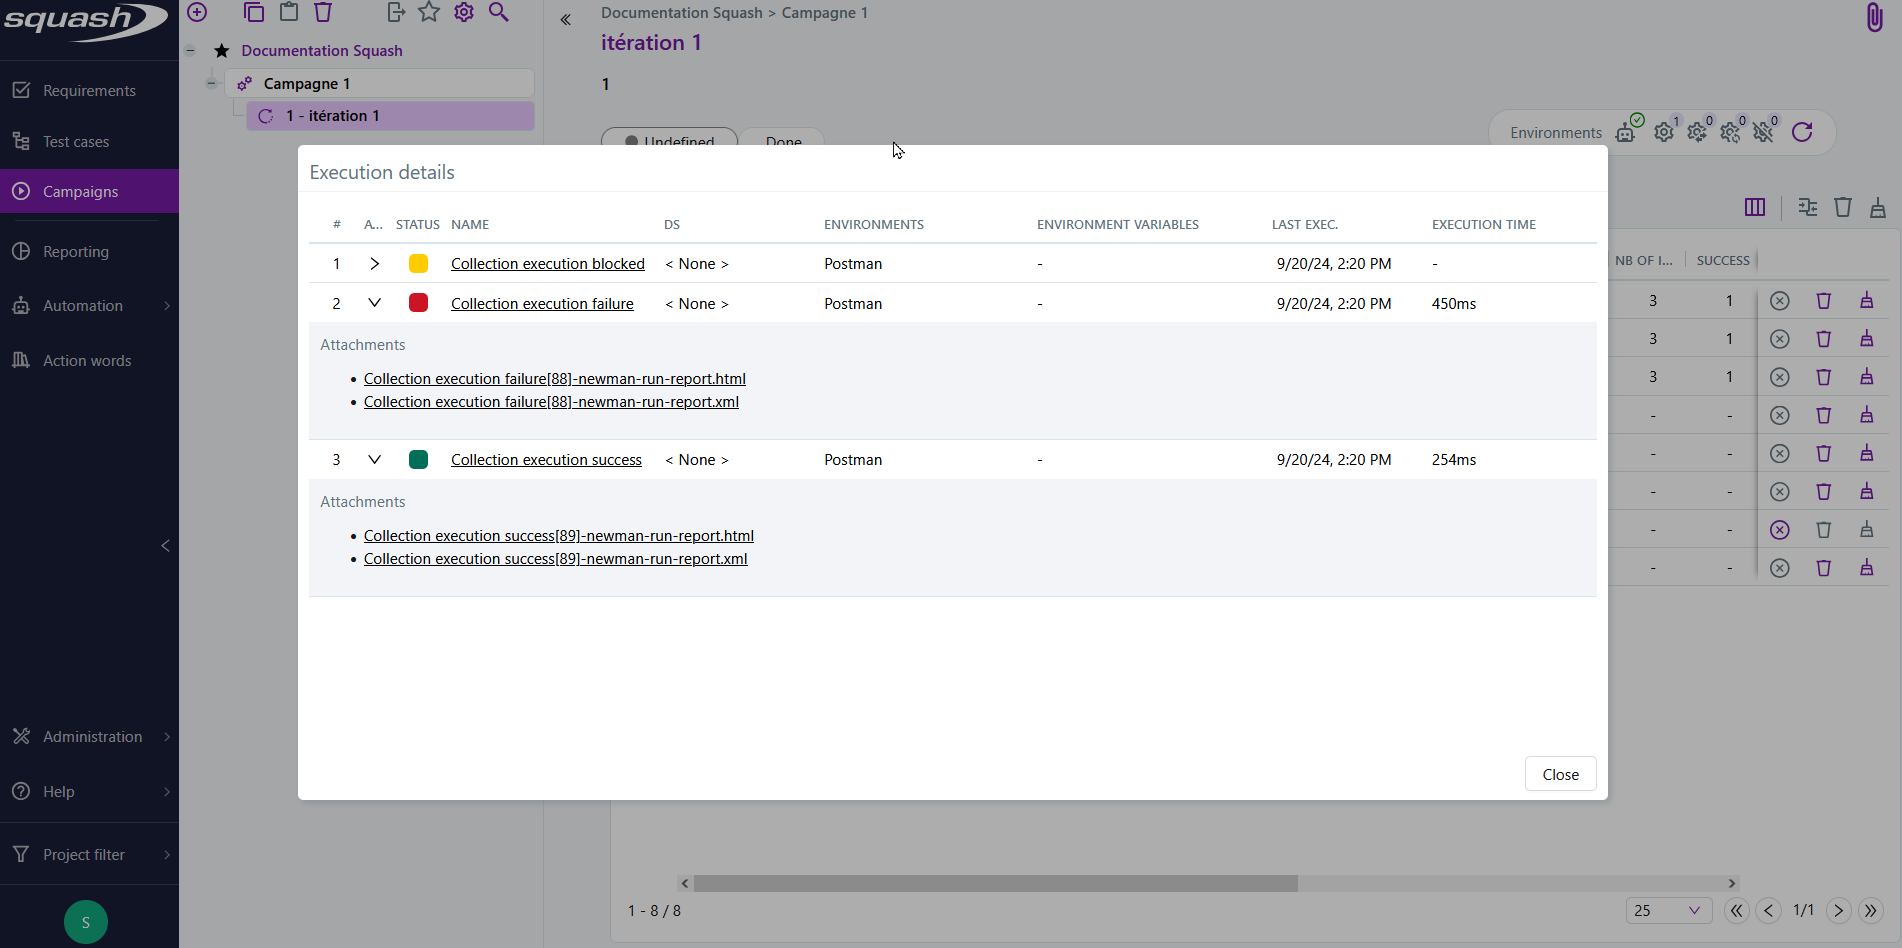
- details containing the list of suite executions as well as execution reports;
- overall report and execution log;
- user who launched the automated tests;
- type of entity from which the suite was launched (Iteration or Suite);
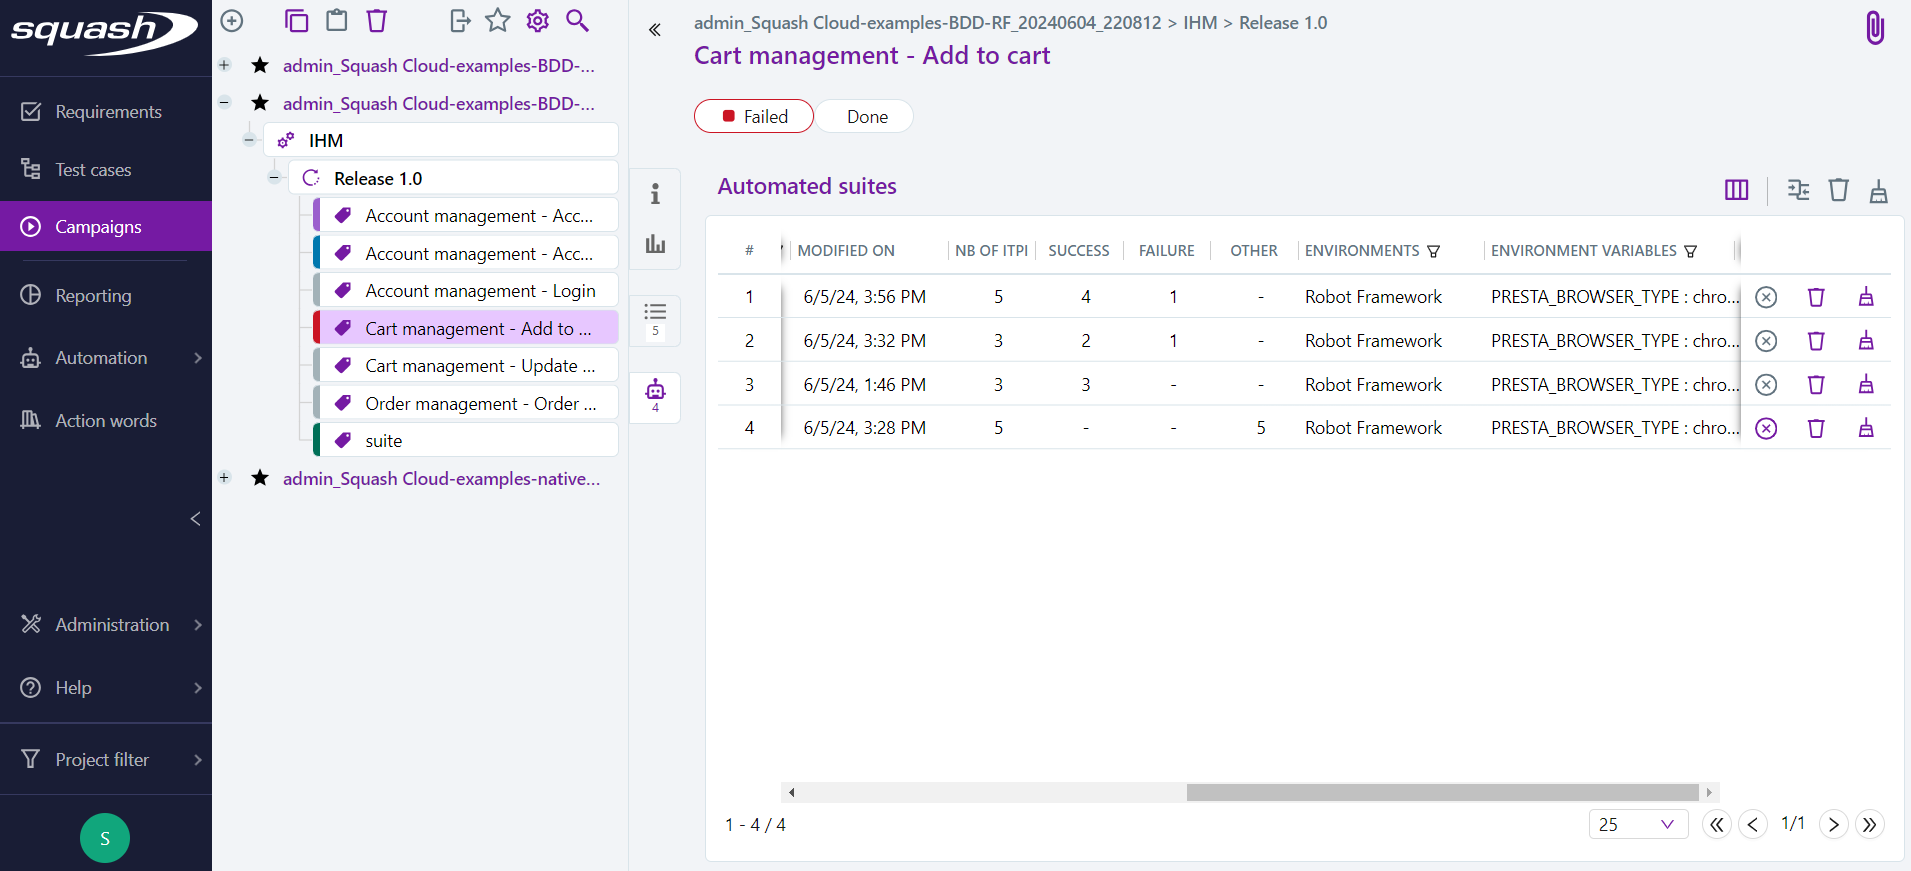
- modification date;
- total number of executions;
- number of executions with a 'Passed' status;
- number of executions with a 'Failed' status;
- number of executions with another status ('Blocked', 'Cancelled', 'Ready', or 'Skipped');
- tags of execution environments used to launch the tests, by default the technology of the automated test;
- environment variables used to launch the tests.
Cleaning Automated Suites
An administrator, project manager, or referent tester can:
- delete one or more automated suites by clicking the
 button;
 - prune partially (only attachments associated with executions with a 'Passed' status will be deleted) by clicking the
 button, then selecting "Prune partially";
 - prune fully (attachments from all executions will be deleted) one or more automated suites by clicking the button, then selecting "Prune fully";
- stop an automated suite launched from Squash TM with a 'Running' status by clicking the
 button.
An advanced tester can stop the automated suites they have launched, but not those launched by other users.
Info
Deletion and cleaning of attachments only apply to completed automated suites. Those with a 'Running' status will be ignored.
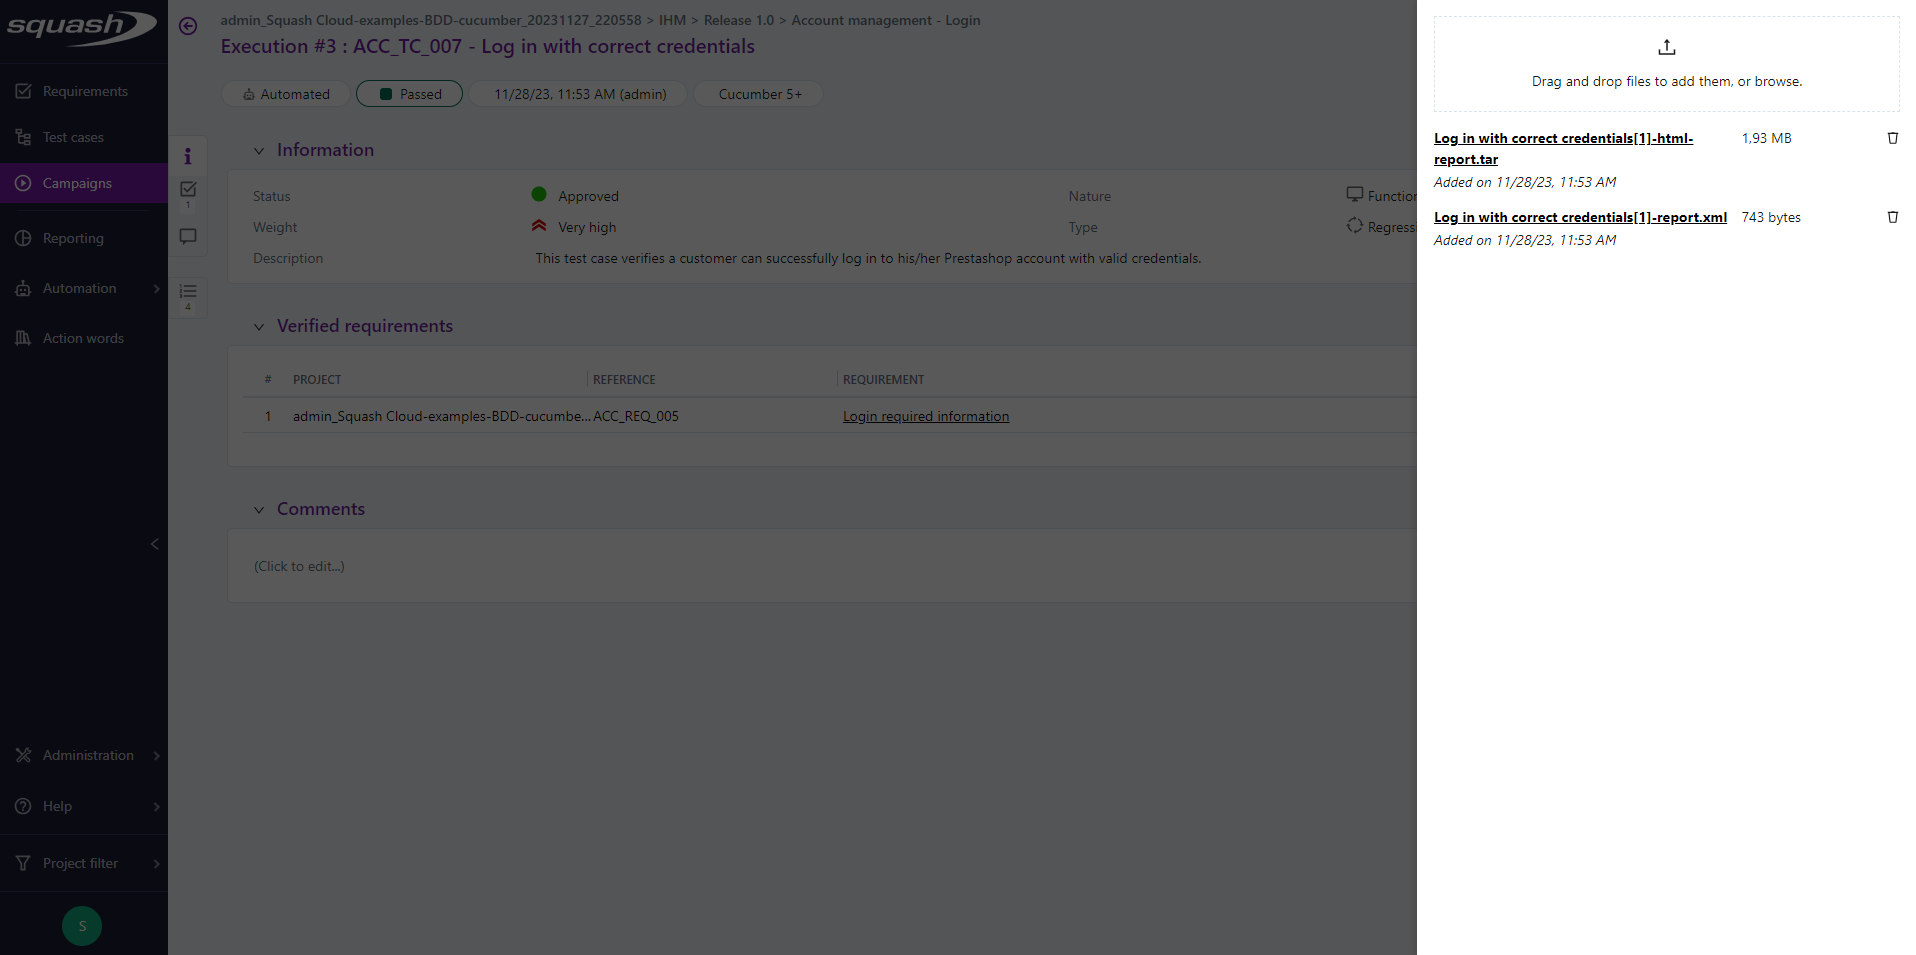
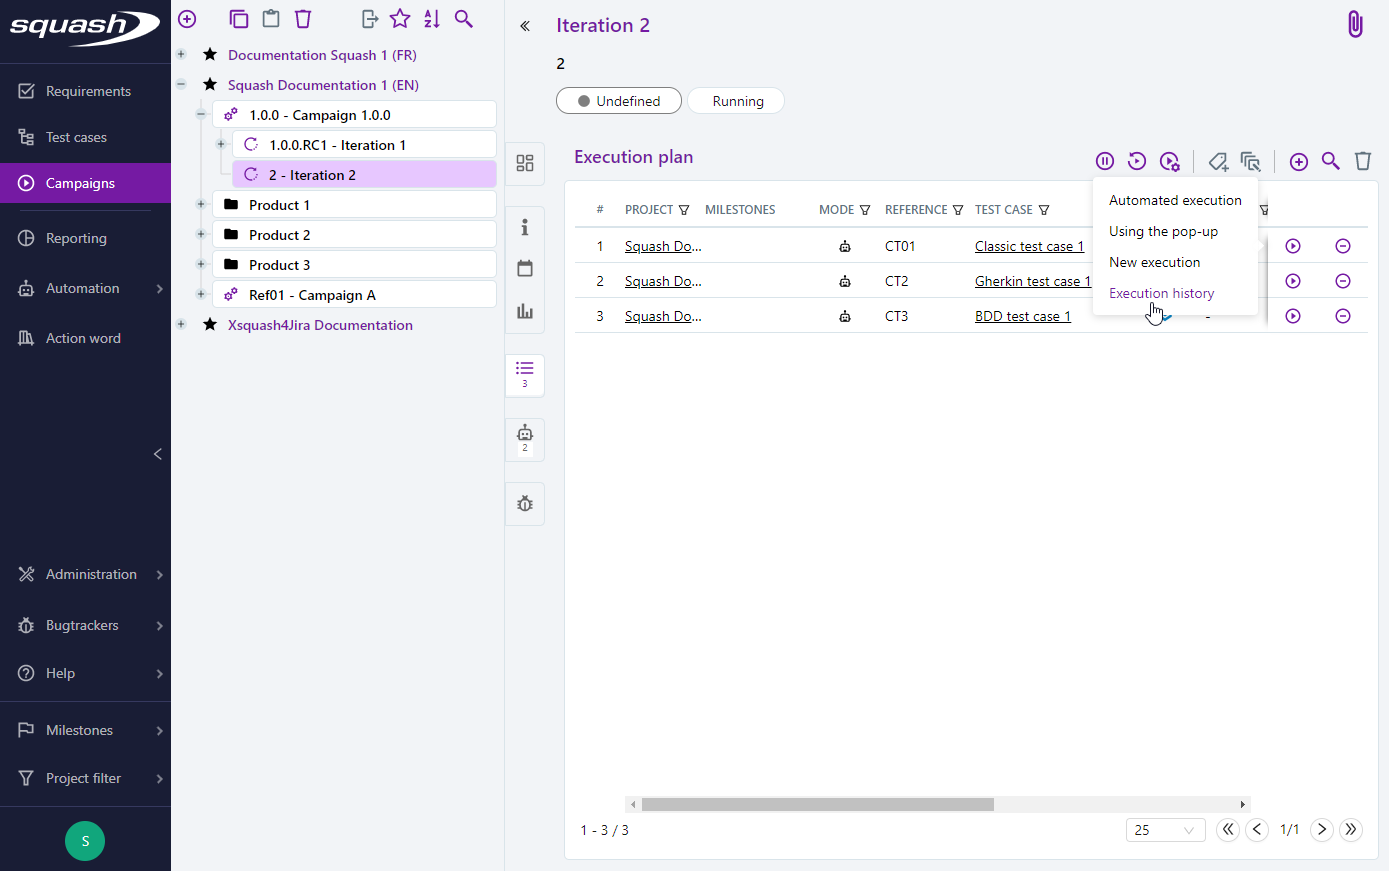
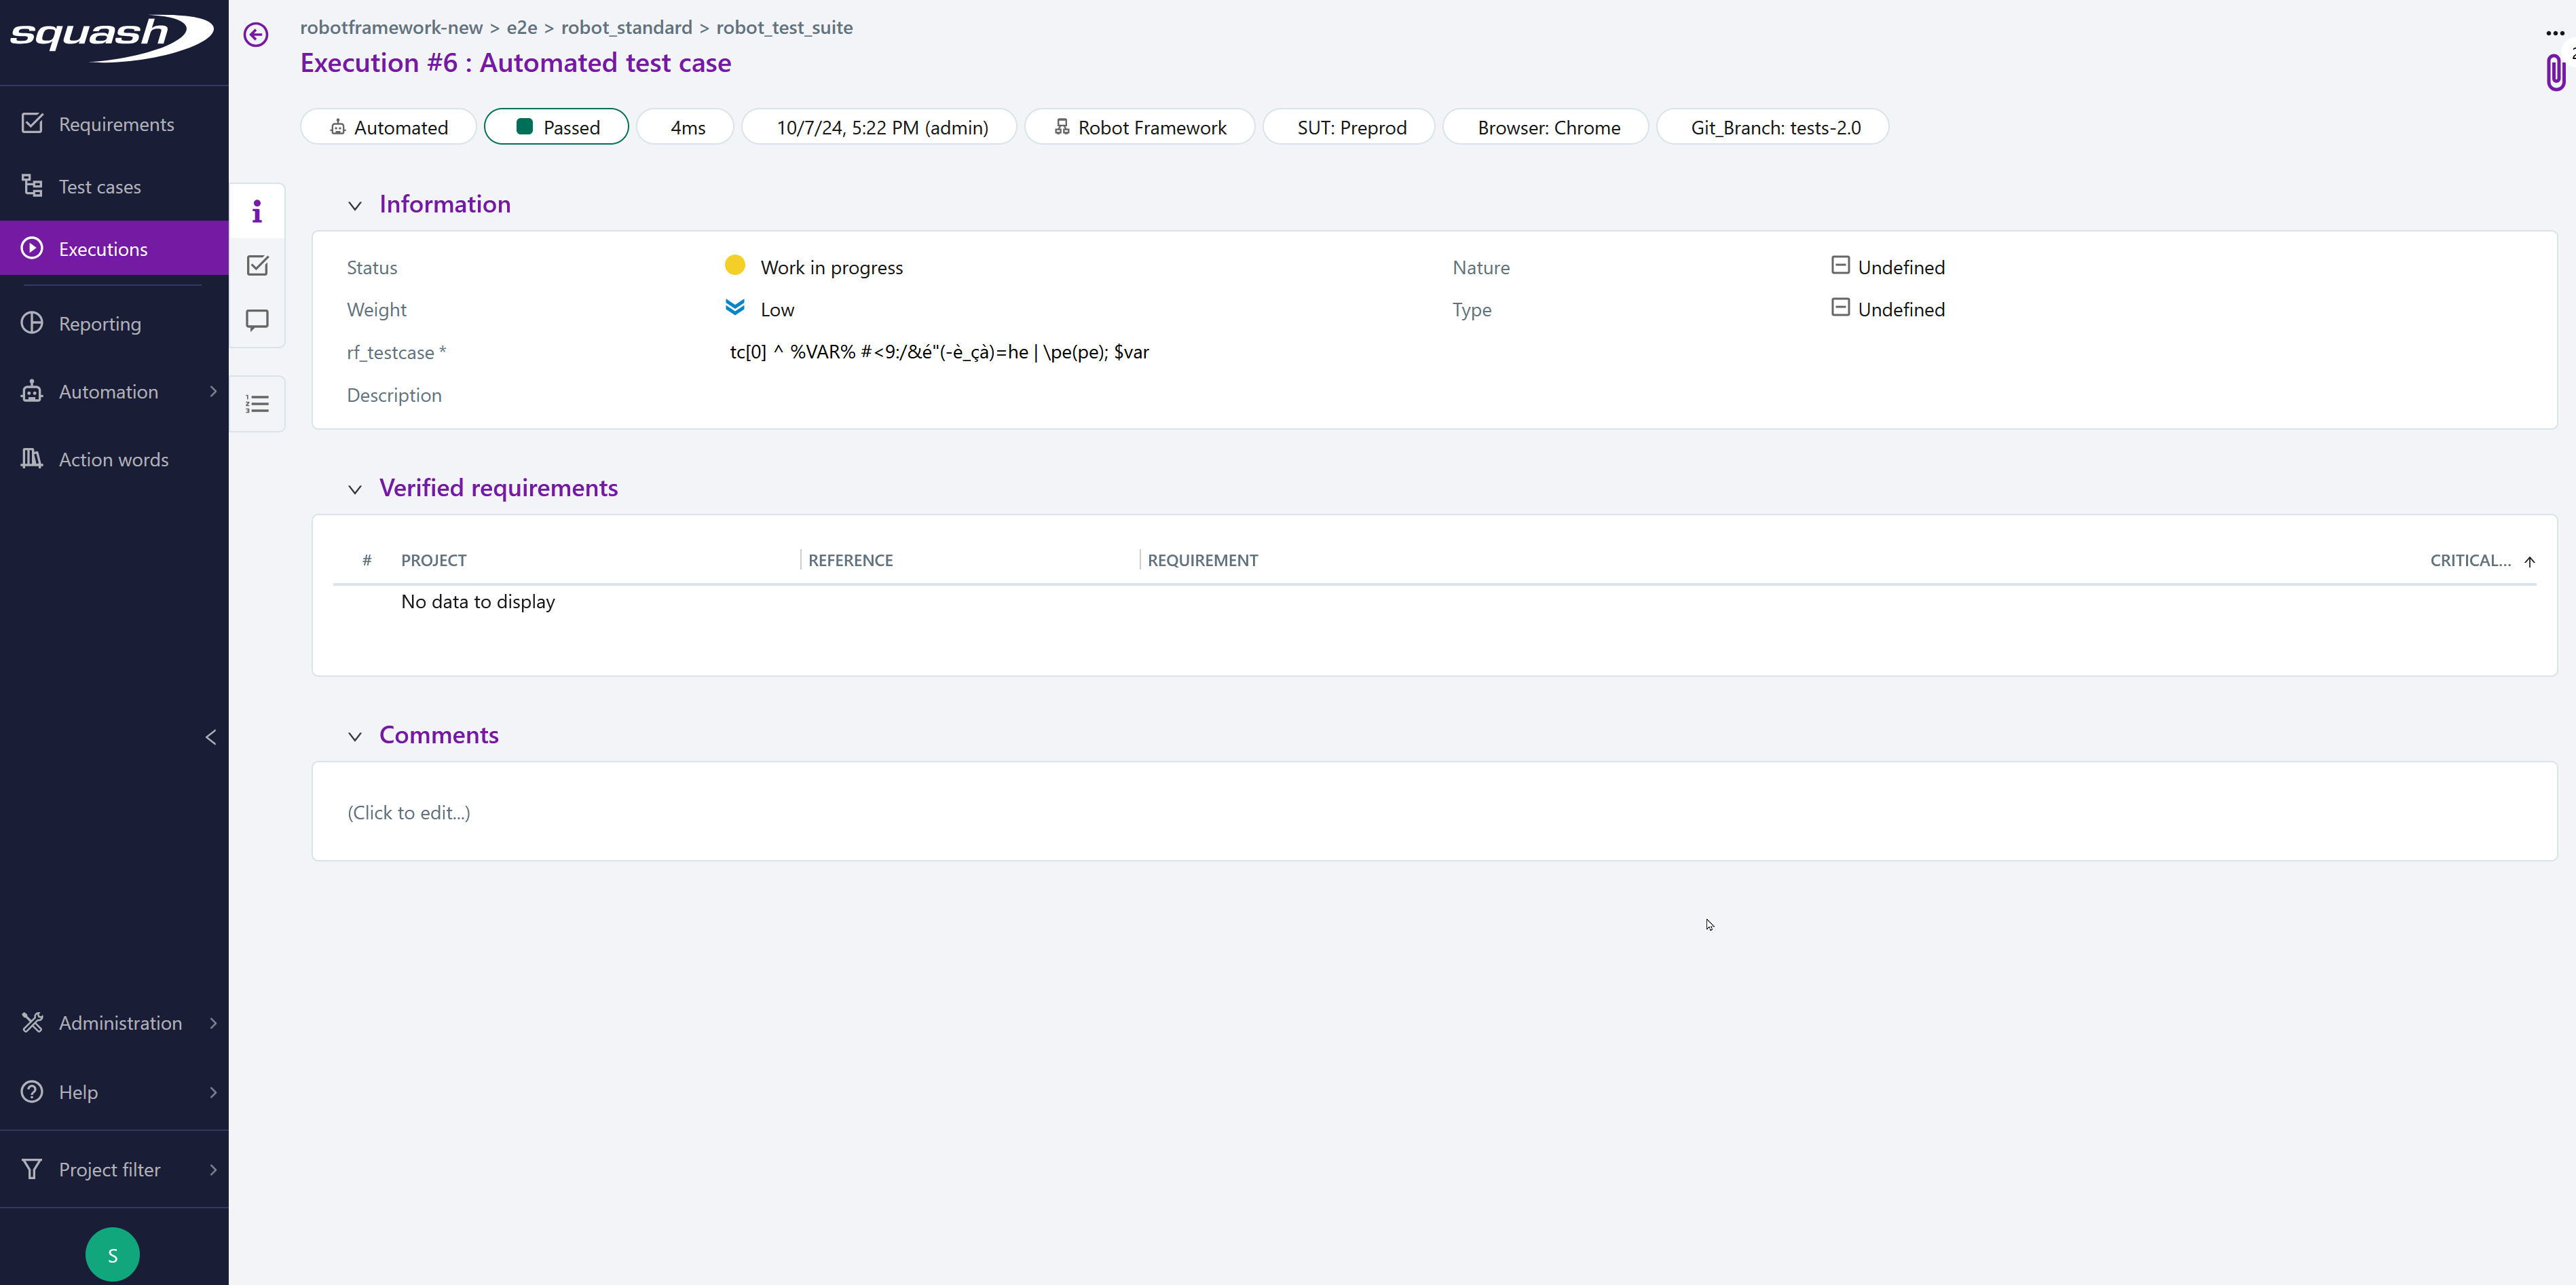
Consult an automated execution and its execution reports
From the execution plan
You can view a run and its reports from the execution plan.
The run consultation page is displayed by clicking on the Run History submenu and then on the run number.
From the execution consultation page, the tags, the environment variables used, and the execution times are visible, and the execution reports can be downloaded in the attachments block.
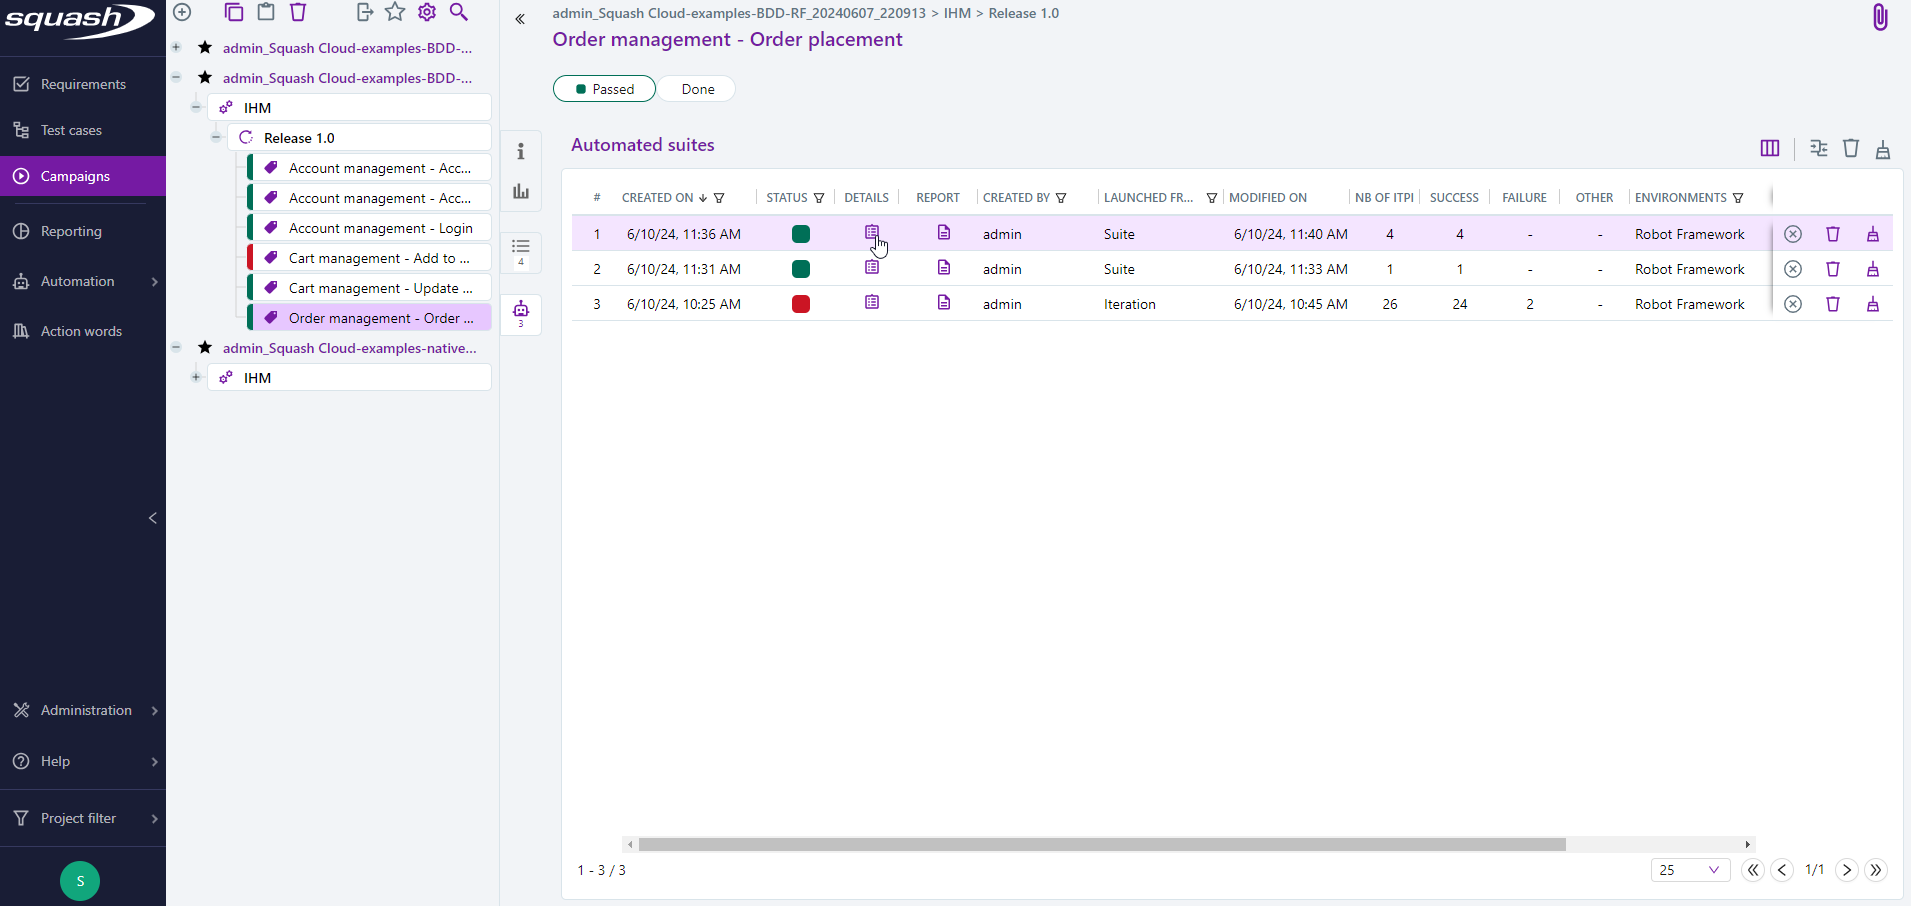
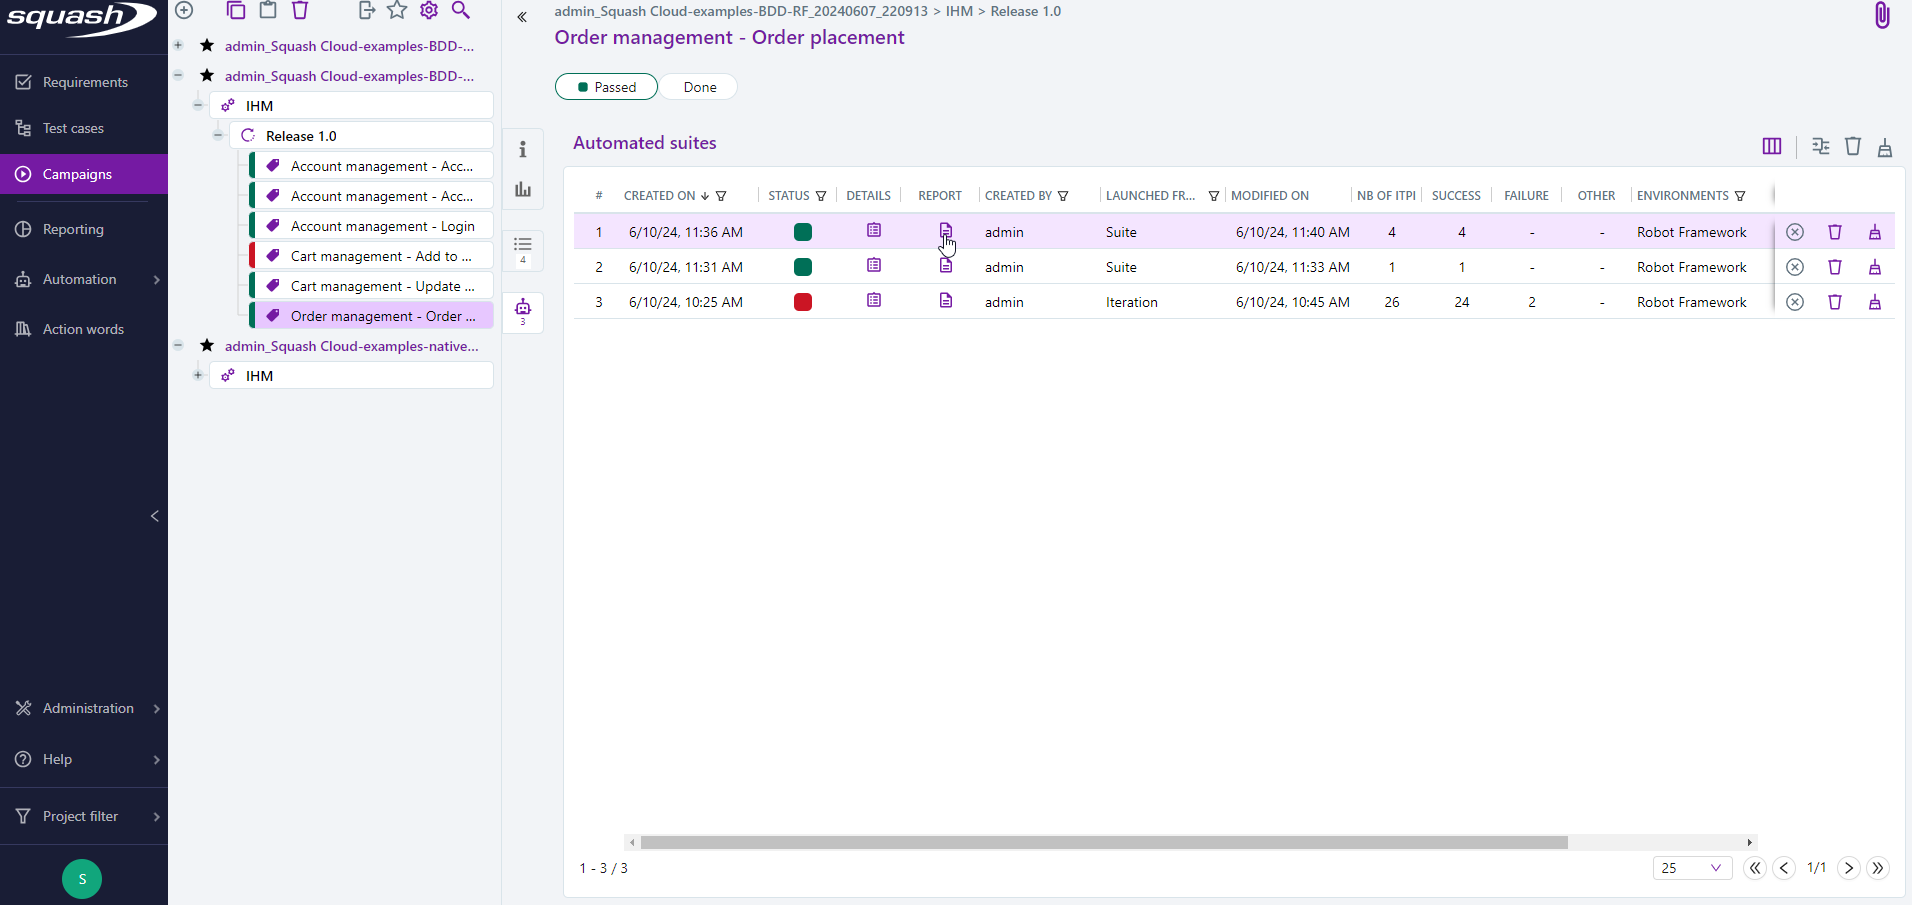
From an automated suite
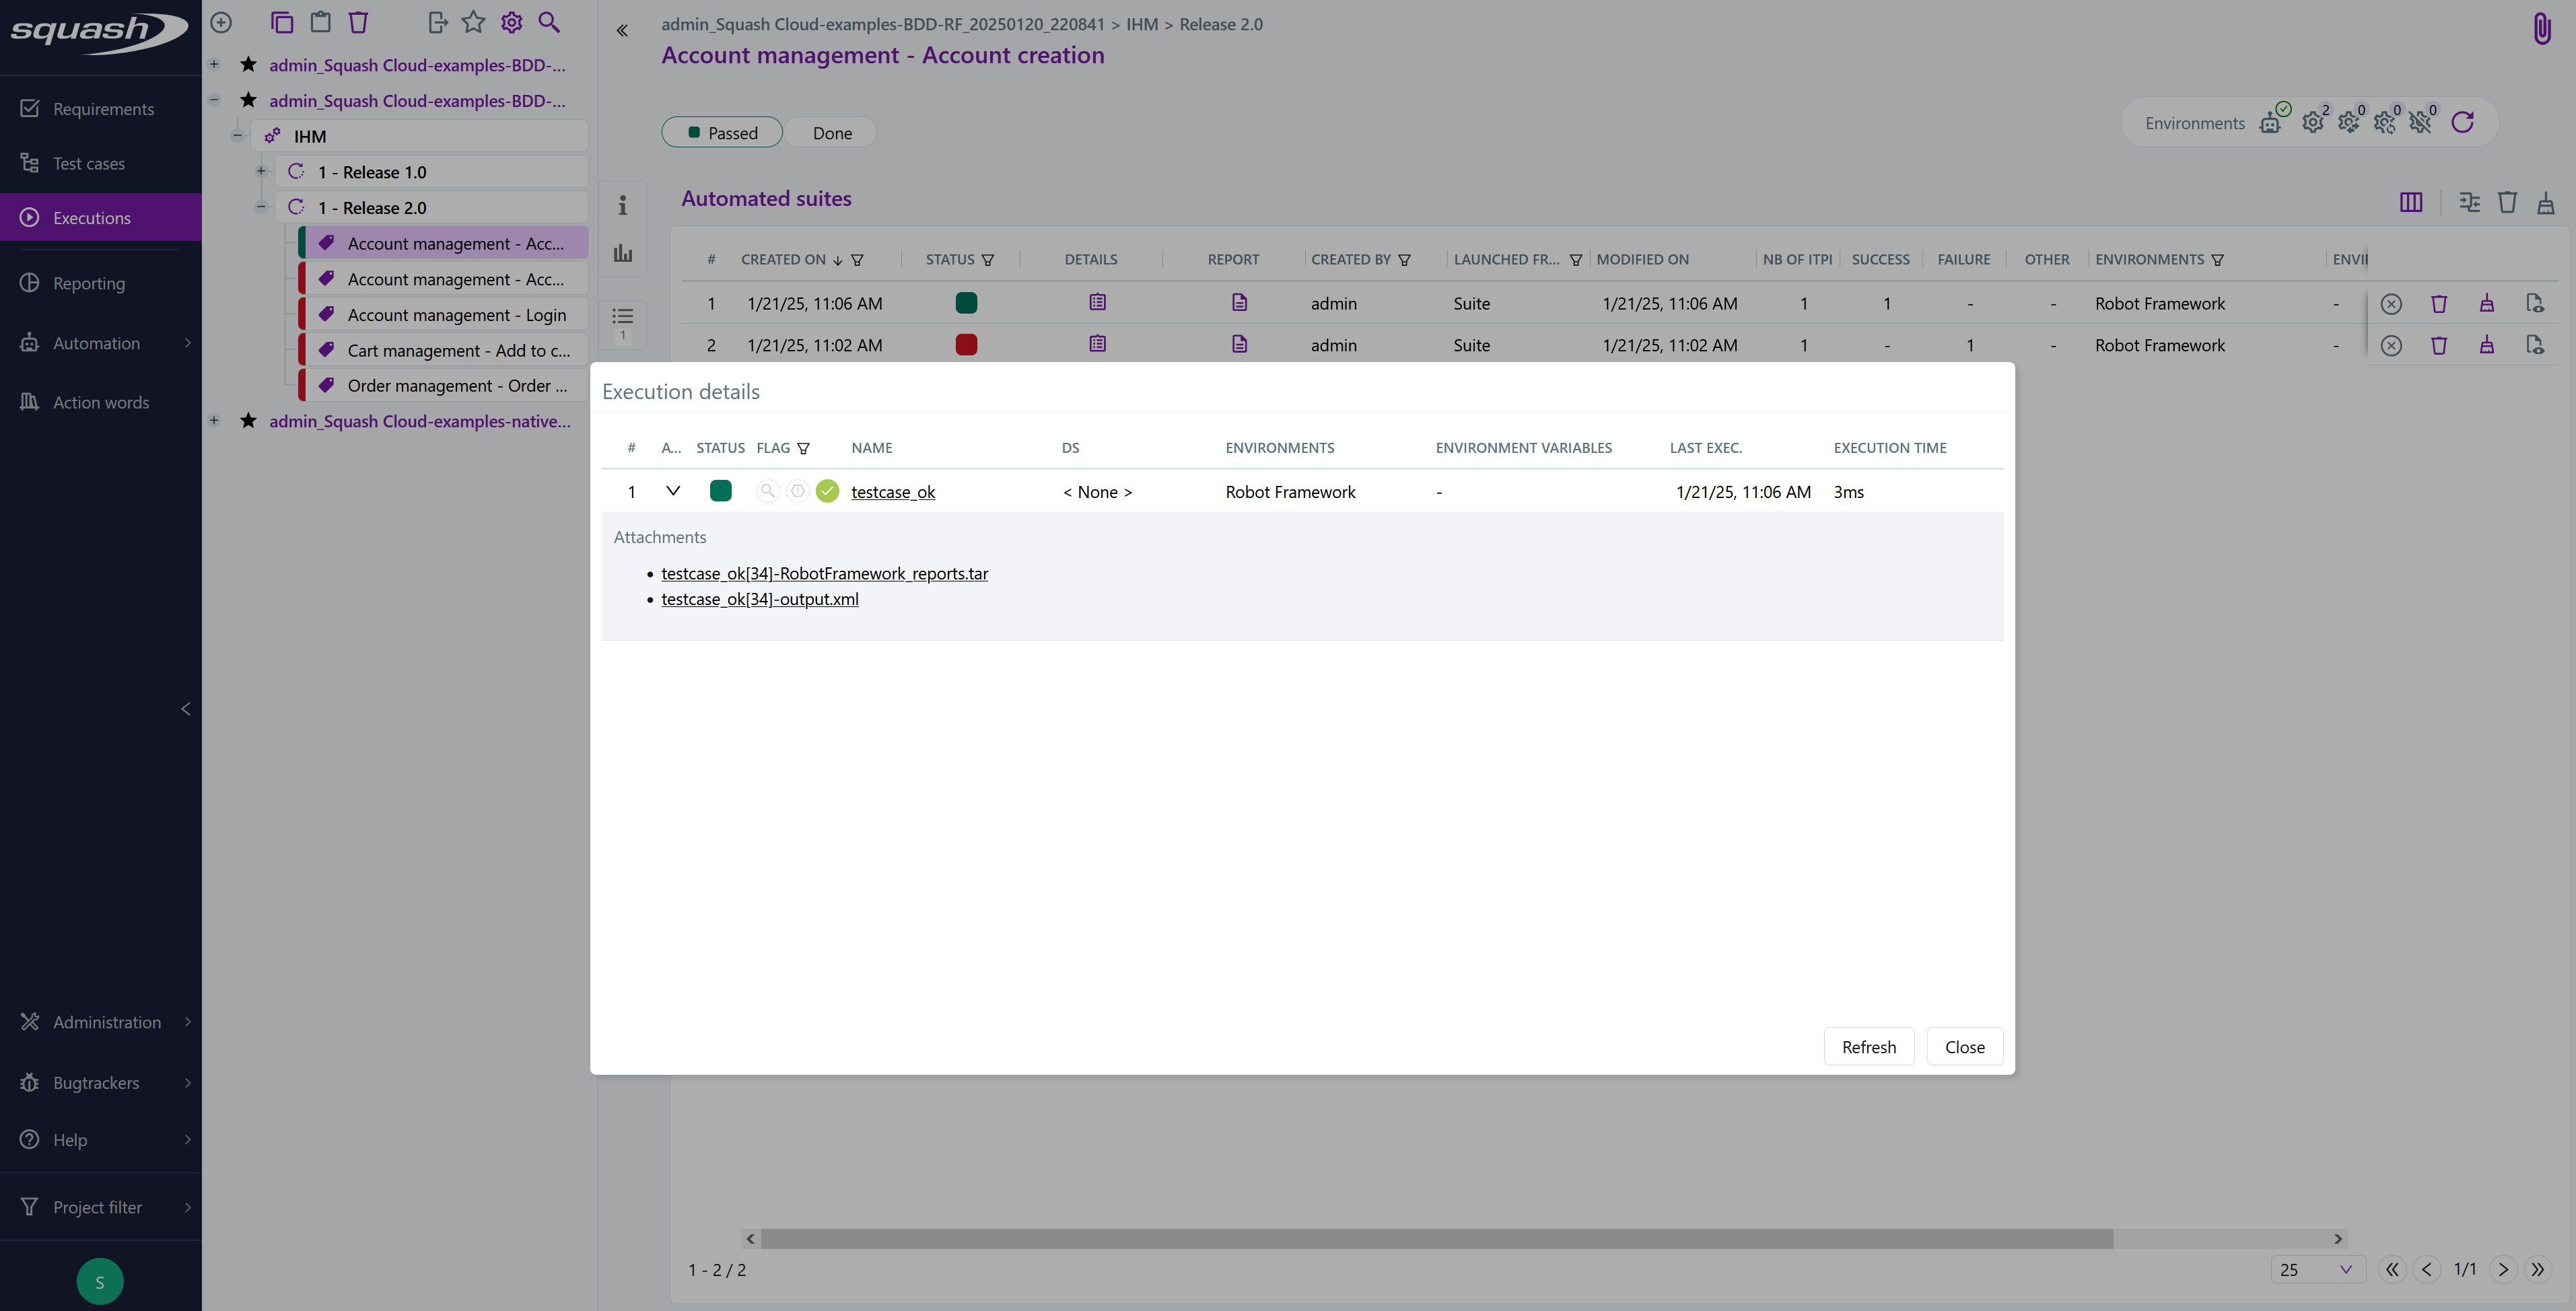
It is possible to view the details of an execution and its reports from the automated suite.
You can view the execution reports by clicking on the  button. They are organized by test case to make them easier to read.
You can view the execution logs for the automated suite by clicking on the  button.
Assertion Failures
Info
This feature is available with Squash Premium 👑 and Squash Ultimate 💎 licenses, using the Squash TM Premium plugin.
UFT
Assertion failures are not currently supported for tests executed with UFT.
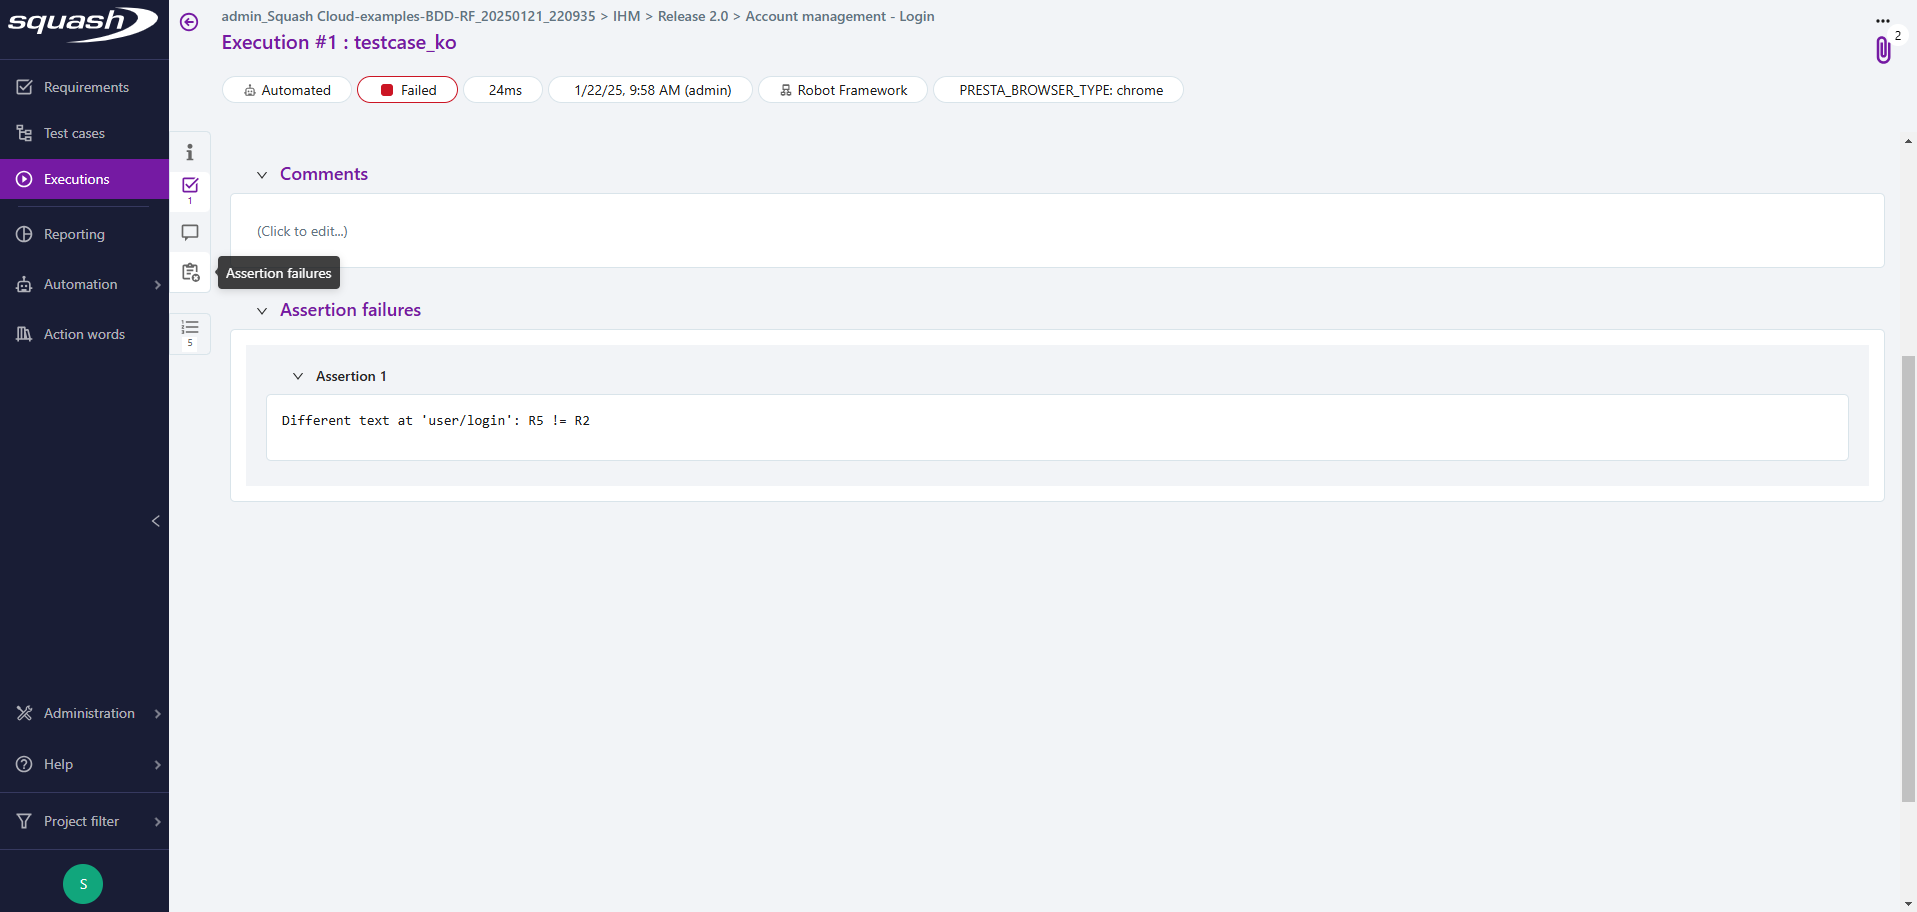
For automated executions run with Squash Orchestrator having the status "Failed", assertion failures are available in Squash.
These assertion failures, extracted from test reports, are transmitted by the orchestrator and are configurable for reports in the Surefire format.
For a given execution, if the same assertion failure appears multiple times in the test report, only one occurrence of the assertion failure will be taken into account and reported.
An assertion failure is linked to an ITPI, and when a new automated execution is created, if the status is "Failed" for the same assertion failure (same text), the assertion is automatically attached to this execution.
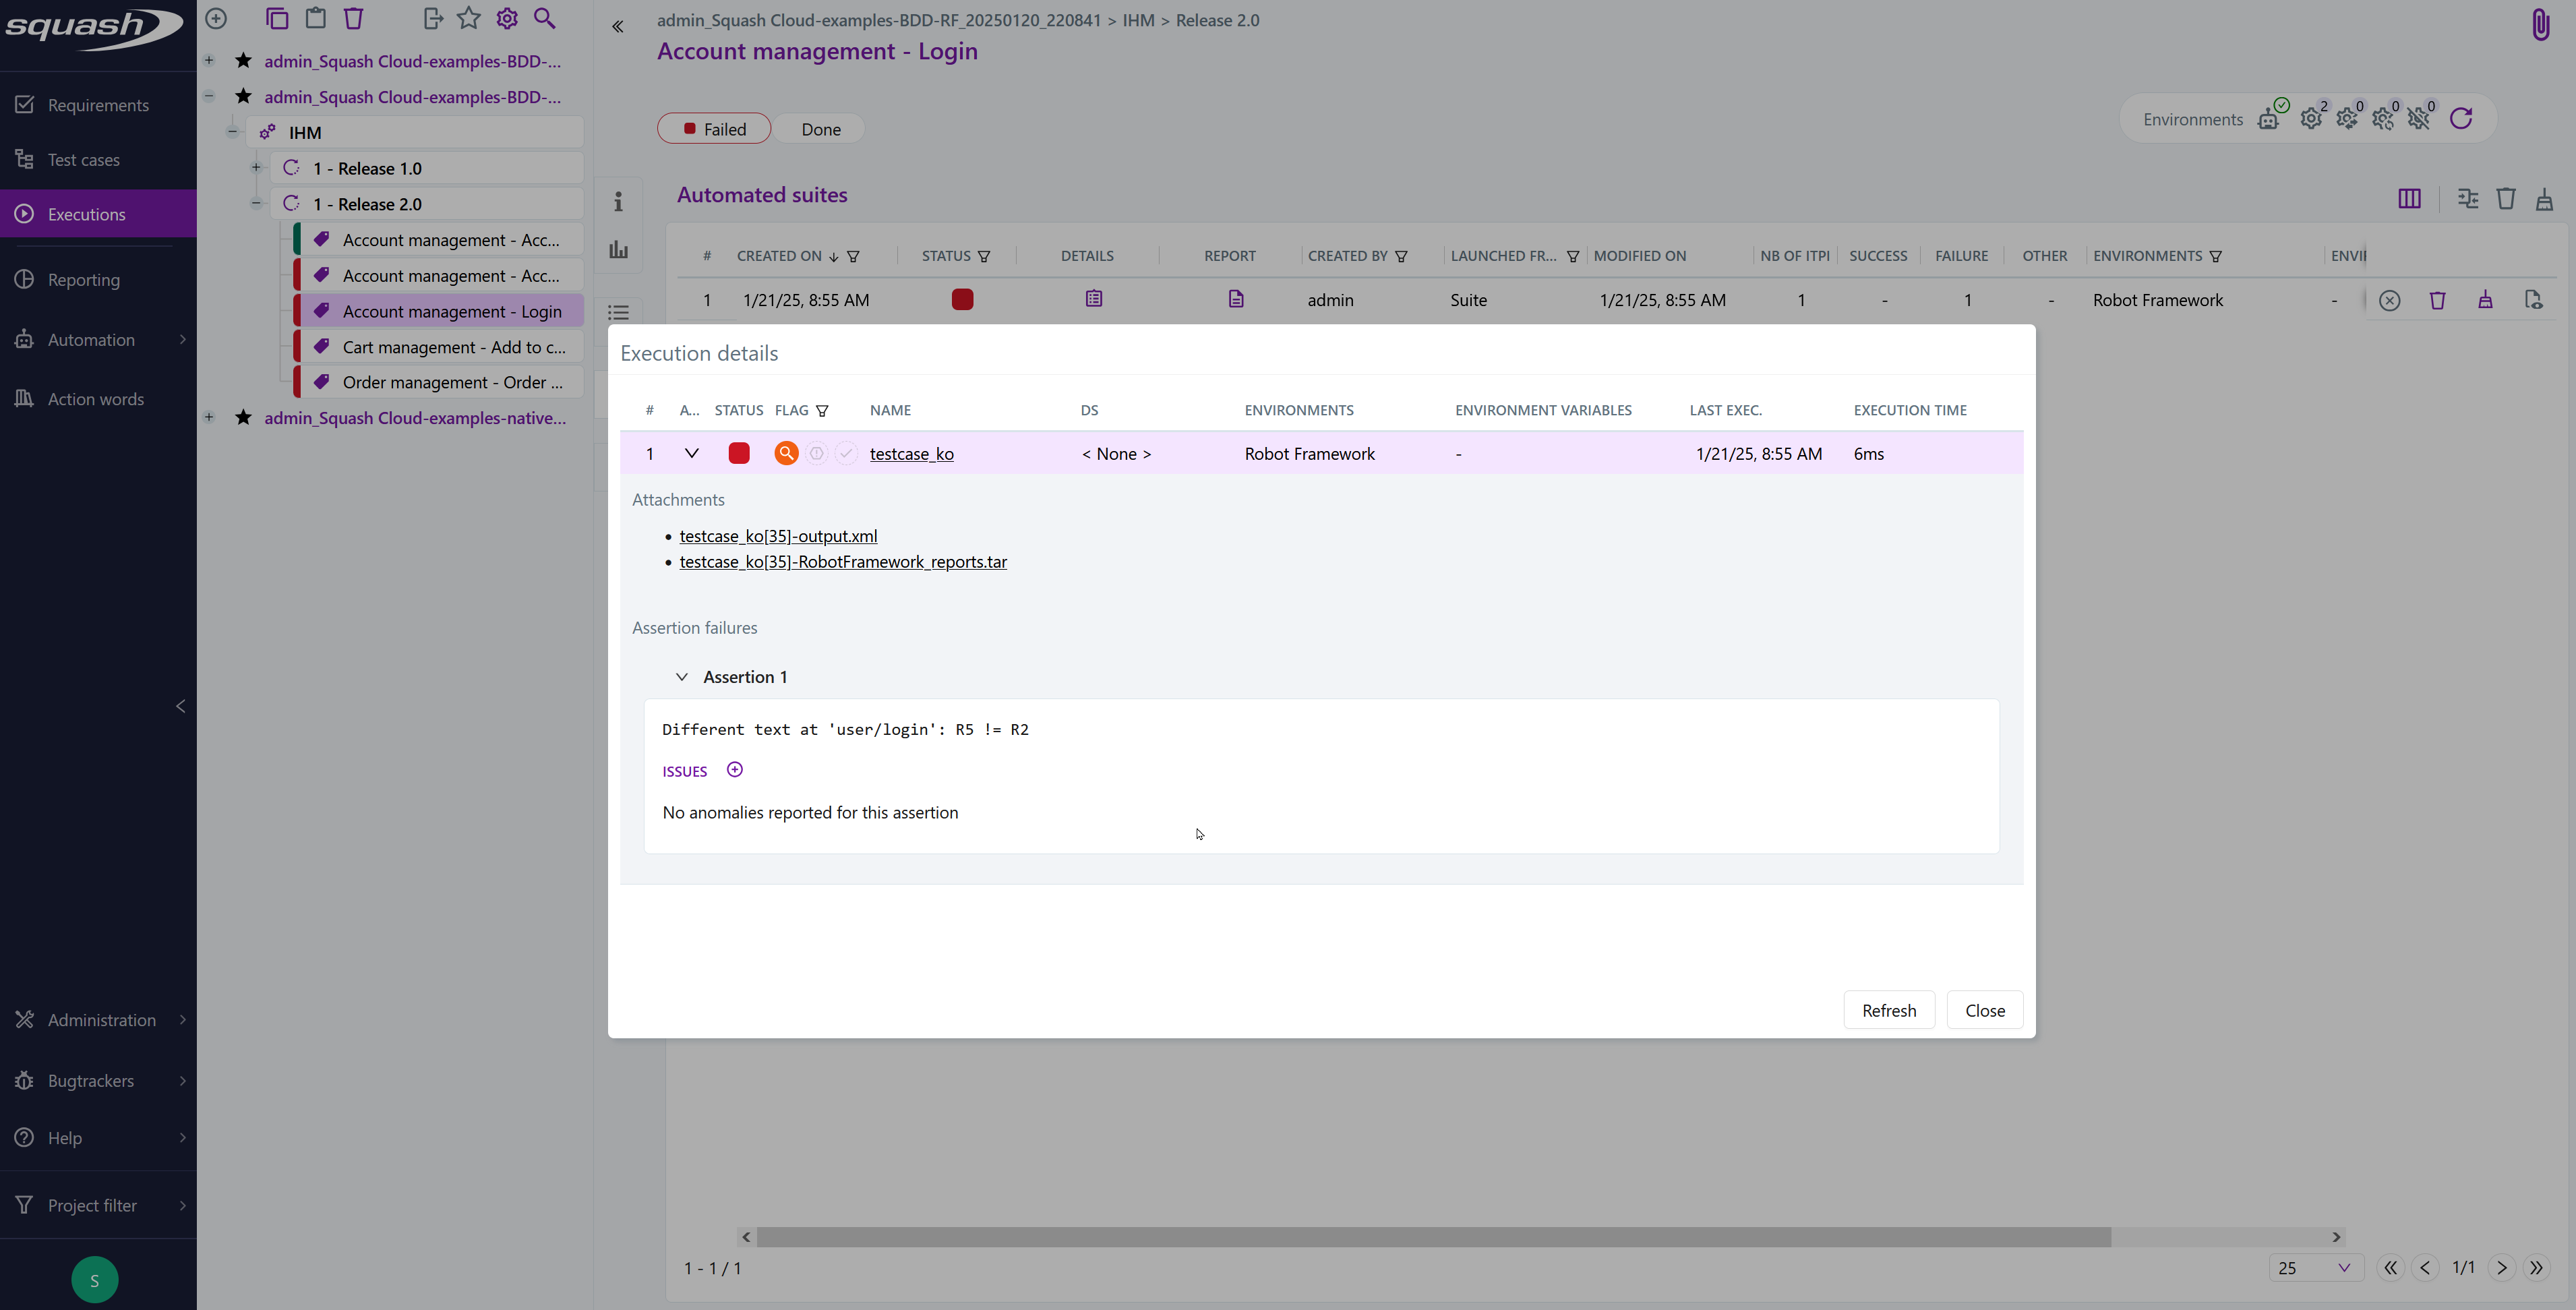
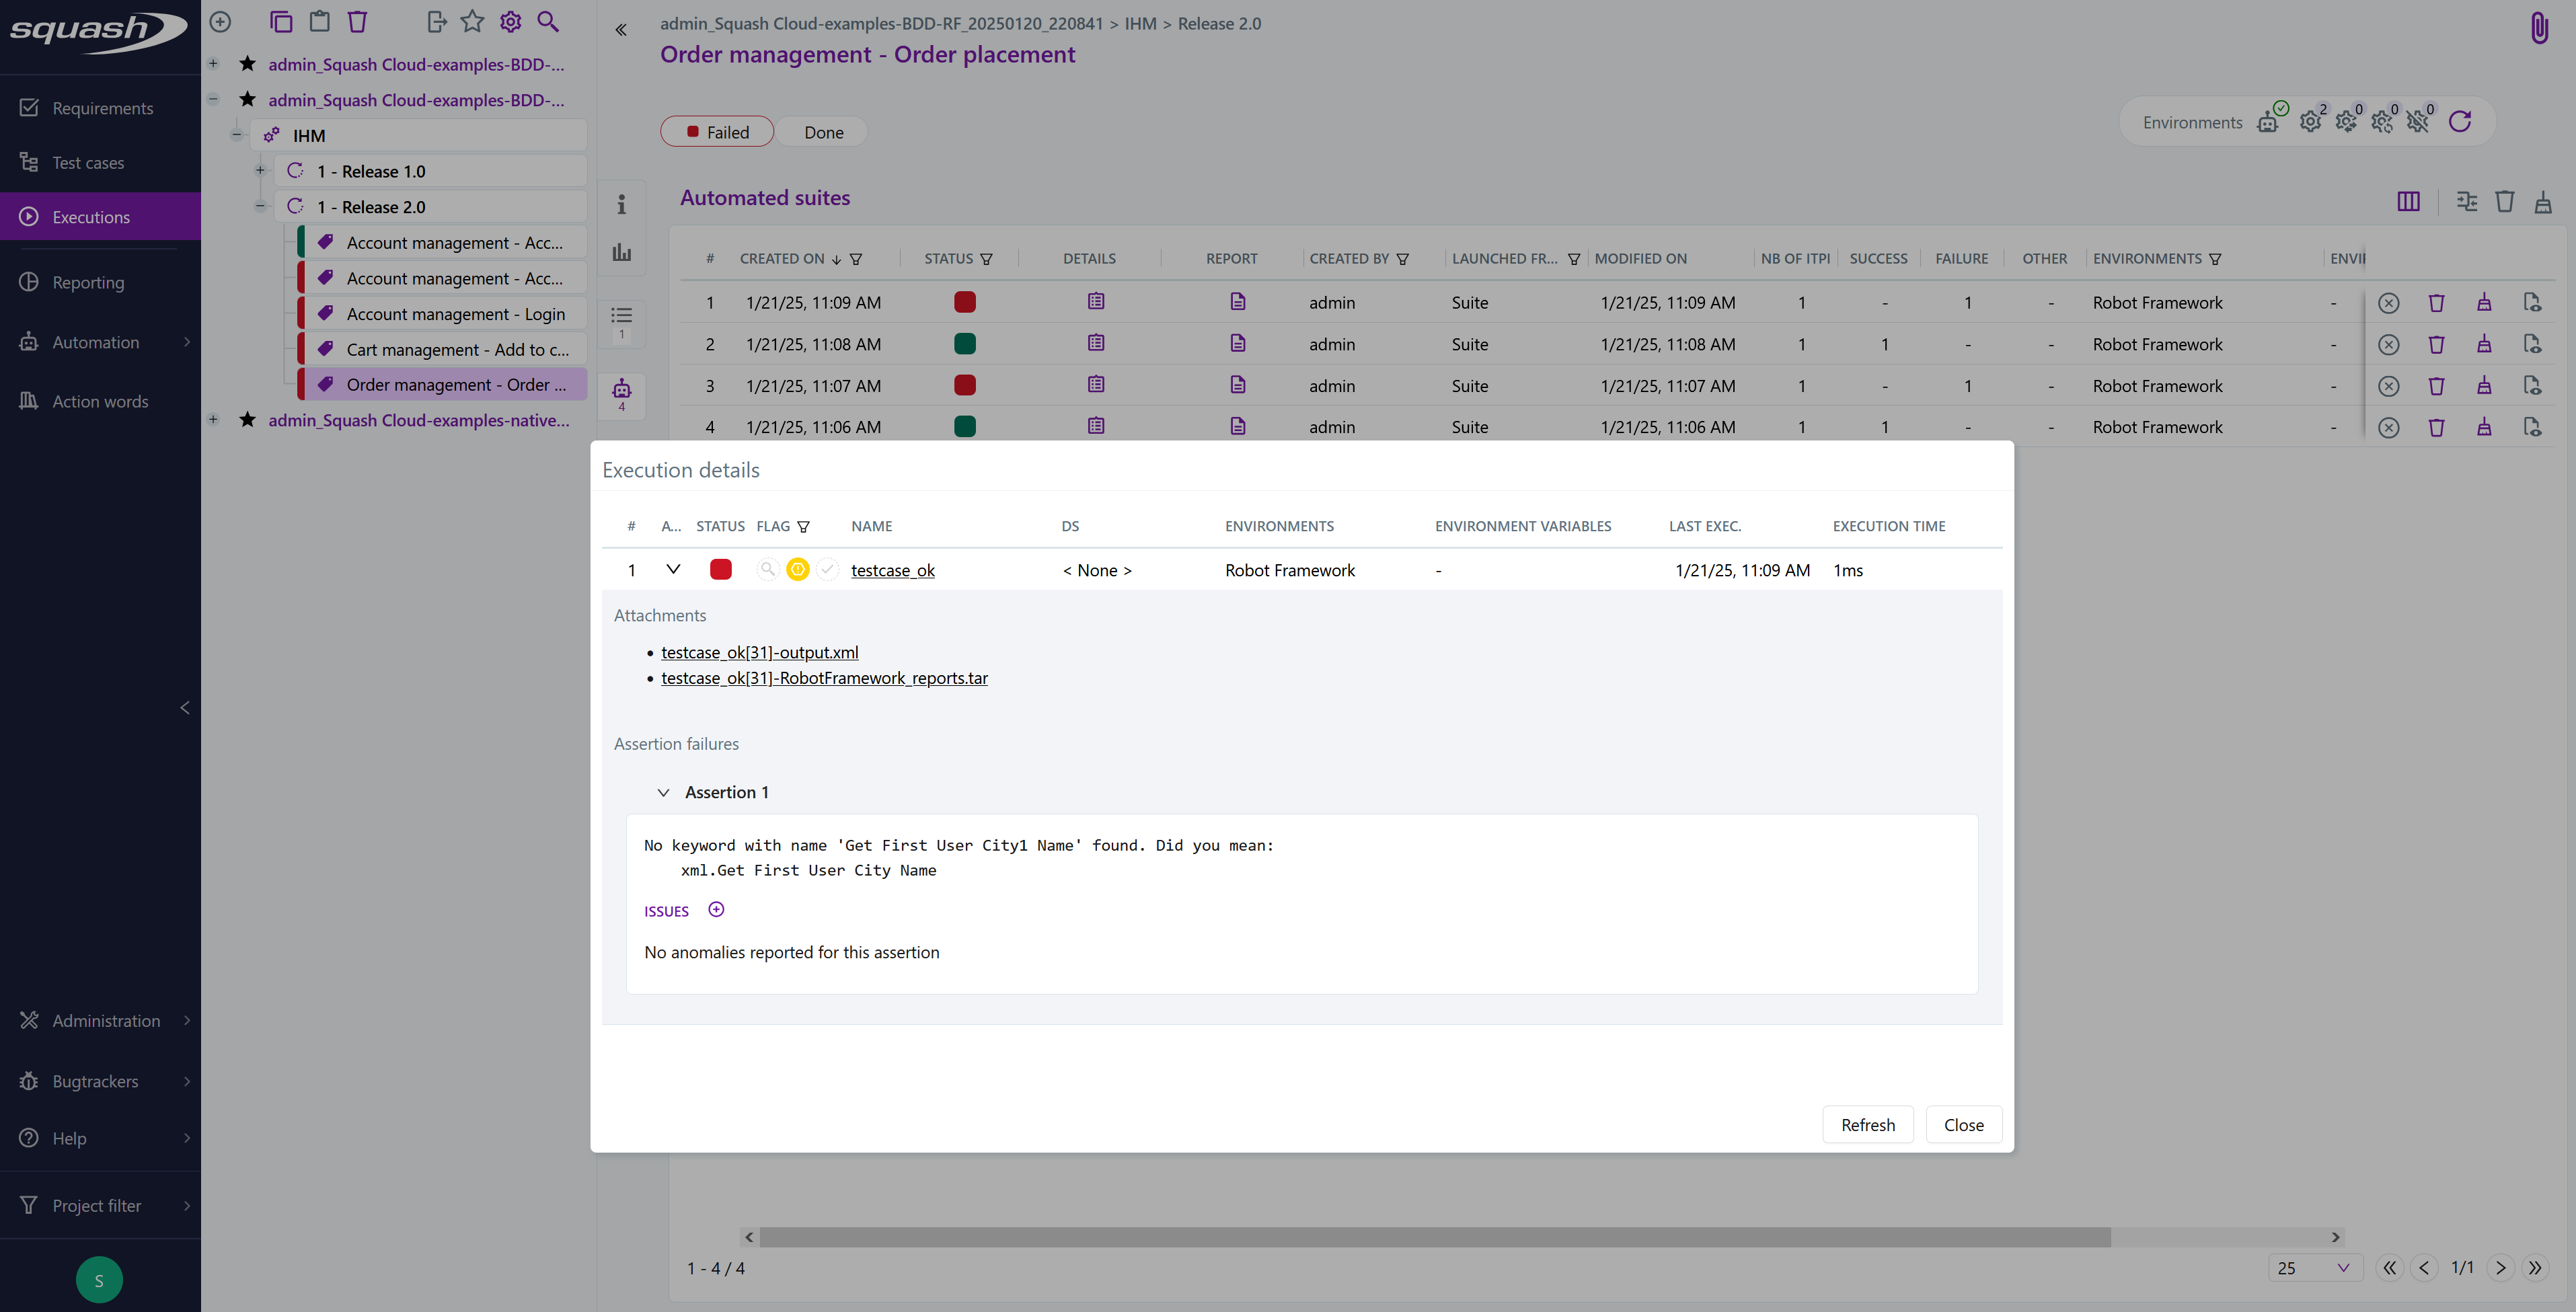
Assertion failures can be viewed:
- On the page of an automated execution:
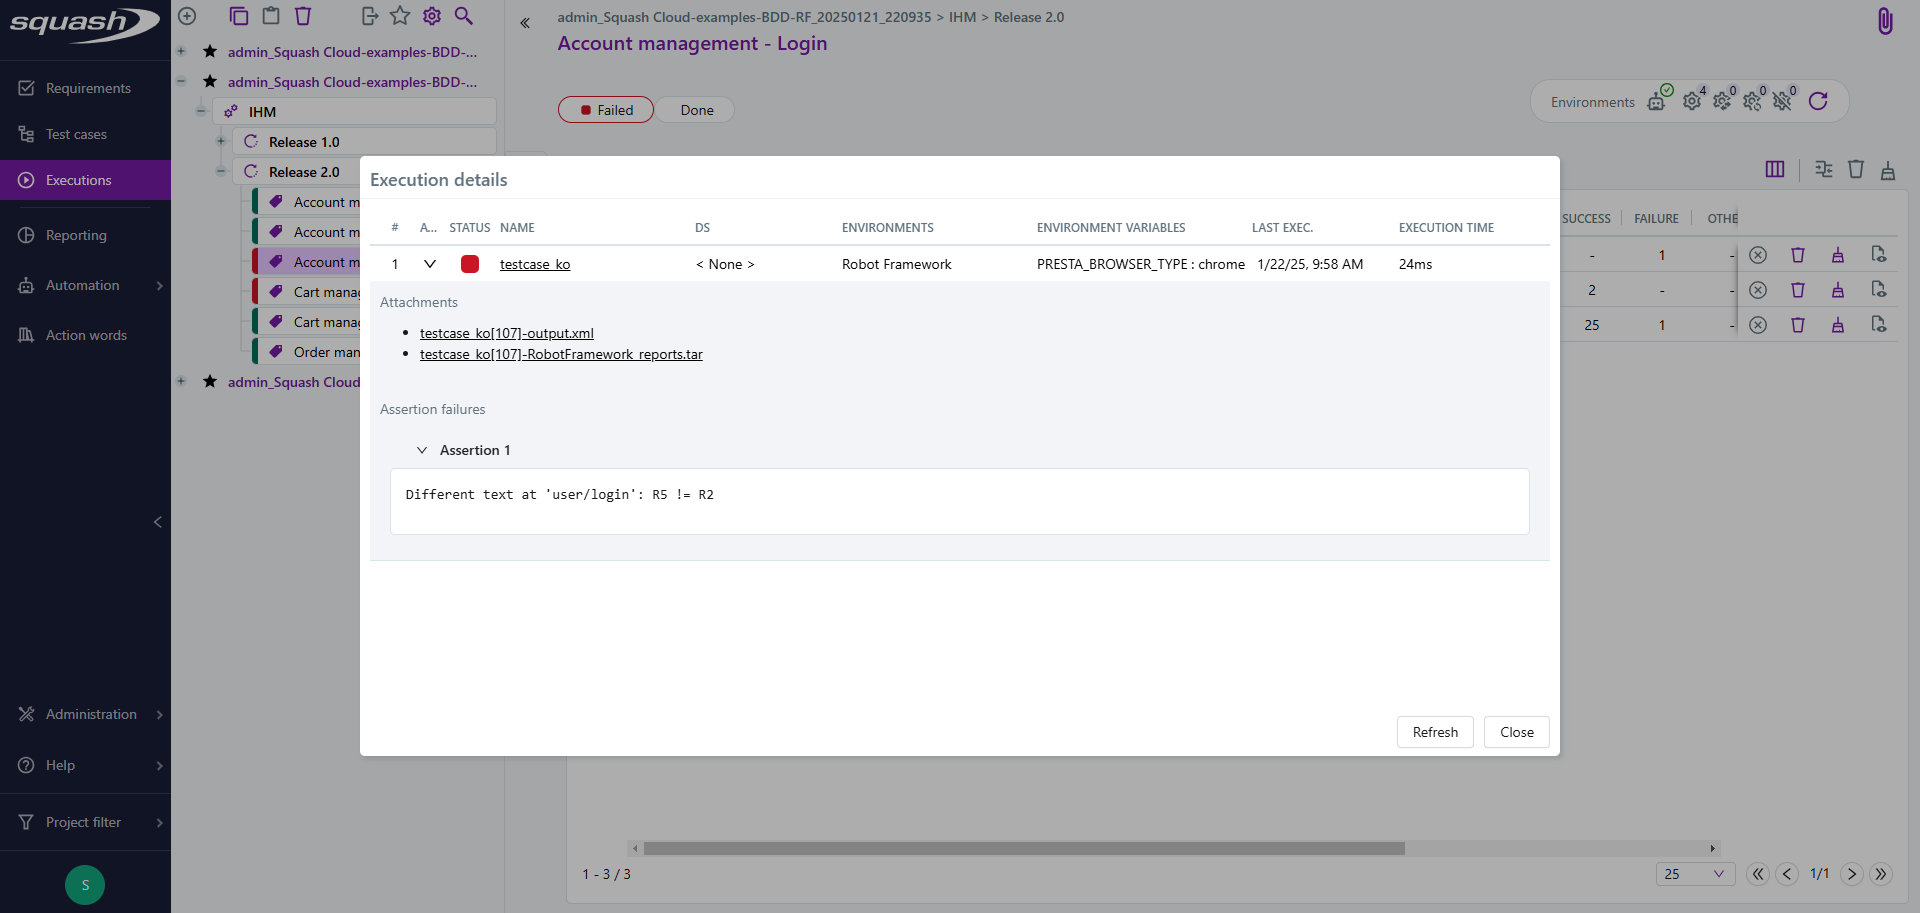
- In the automated suites detail pop-up:
When an ITPI is deleted, all assertion failures linked to that ITPI are also deleted.
Report or attach an Issue to an Assertion Failure
If a bug tracker is linked to the project, you can:
- Report a new issue linked to the assertion failure;
- Attach an existing issue in the bug tracker to an assertion failure;
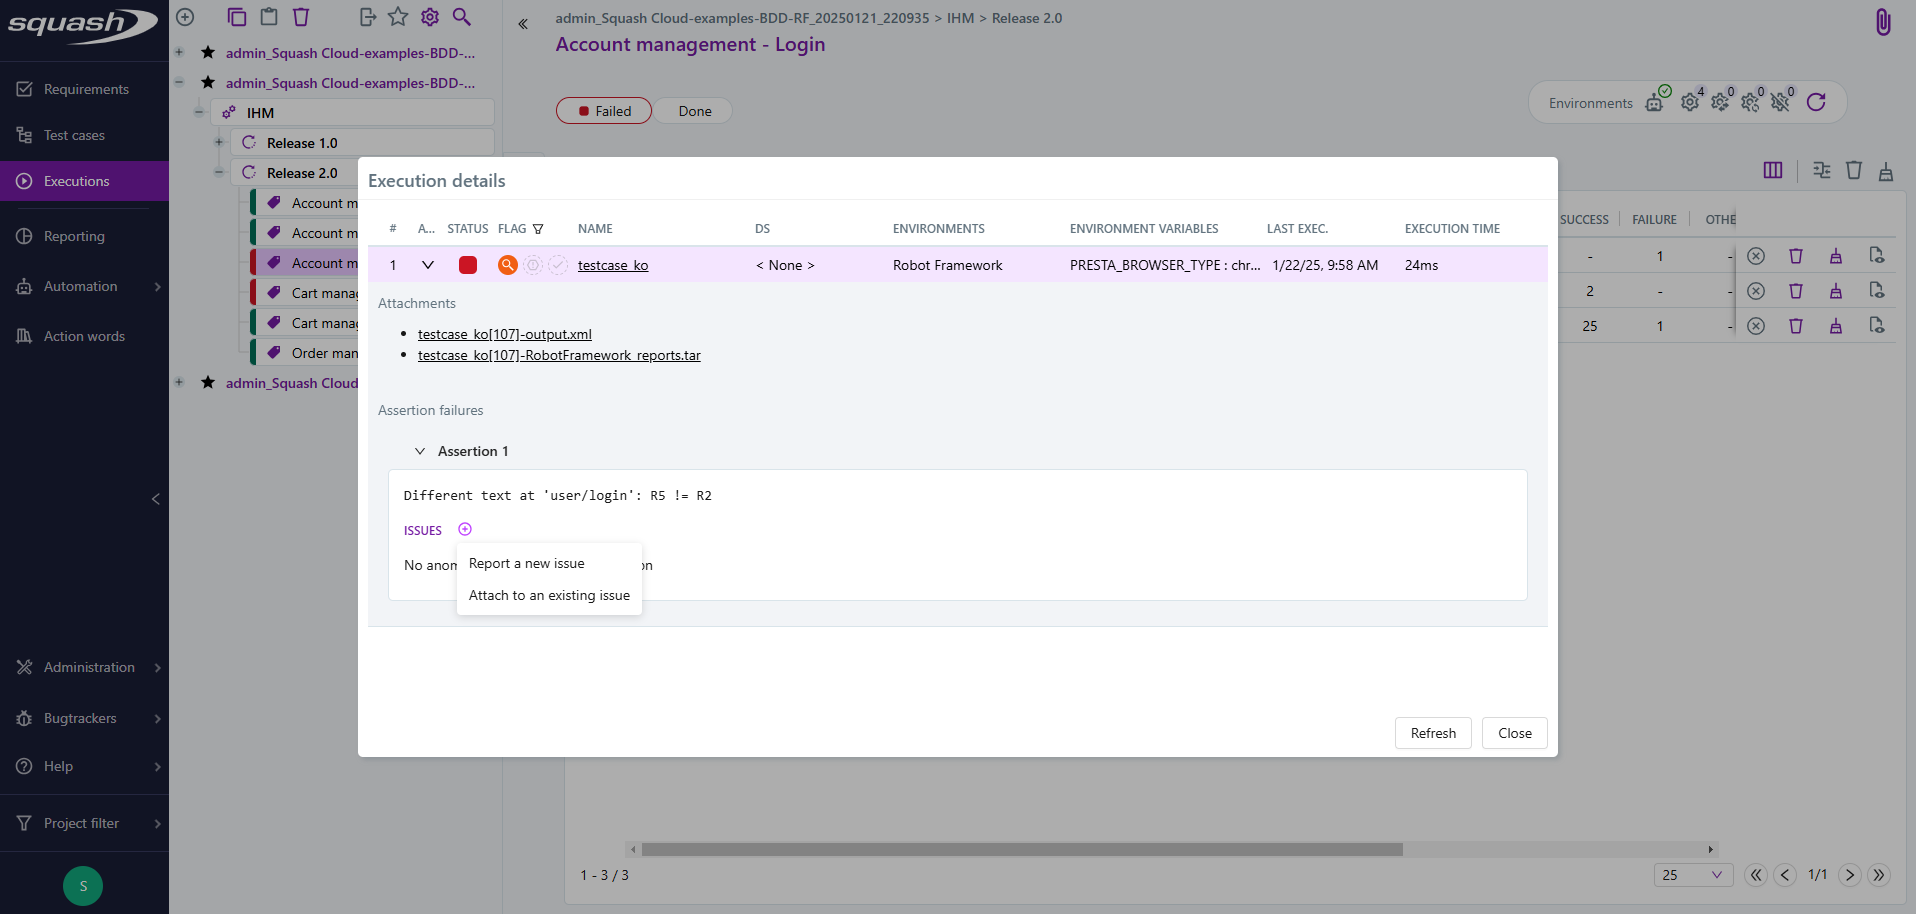
- View the list of issues associated with an assertion failure.
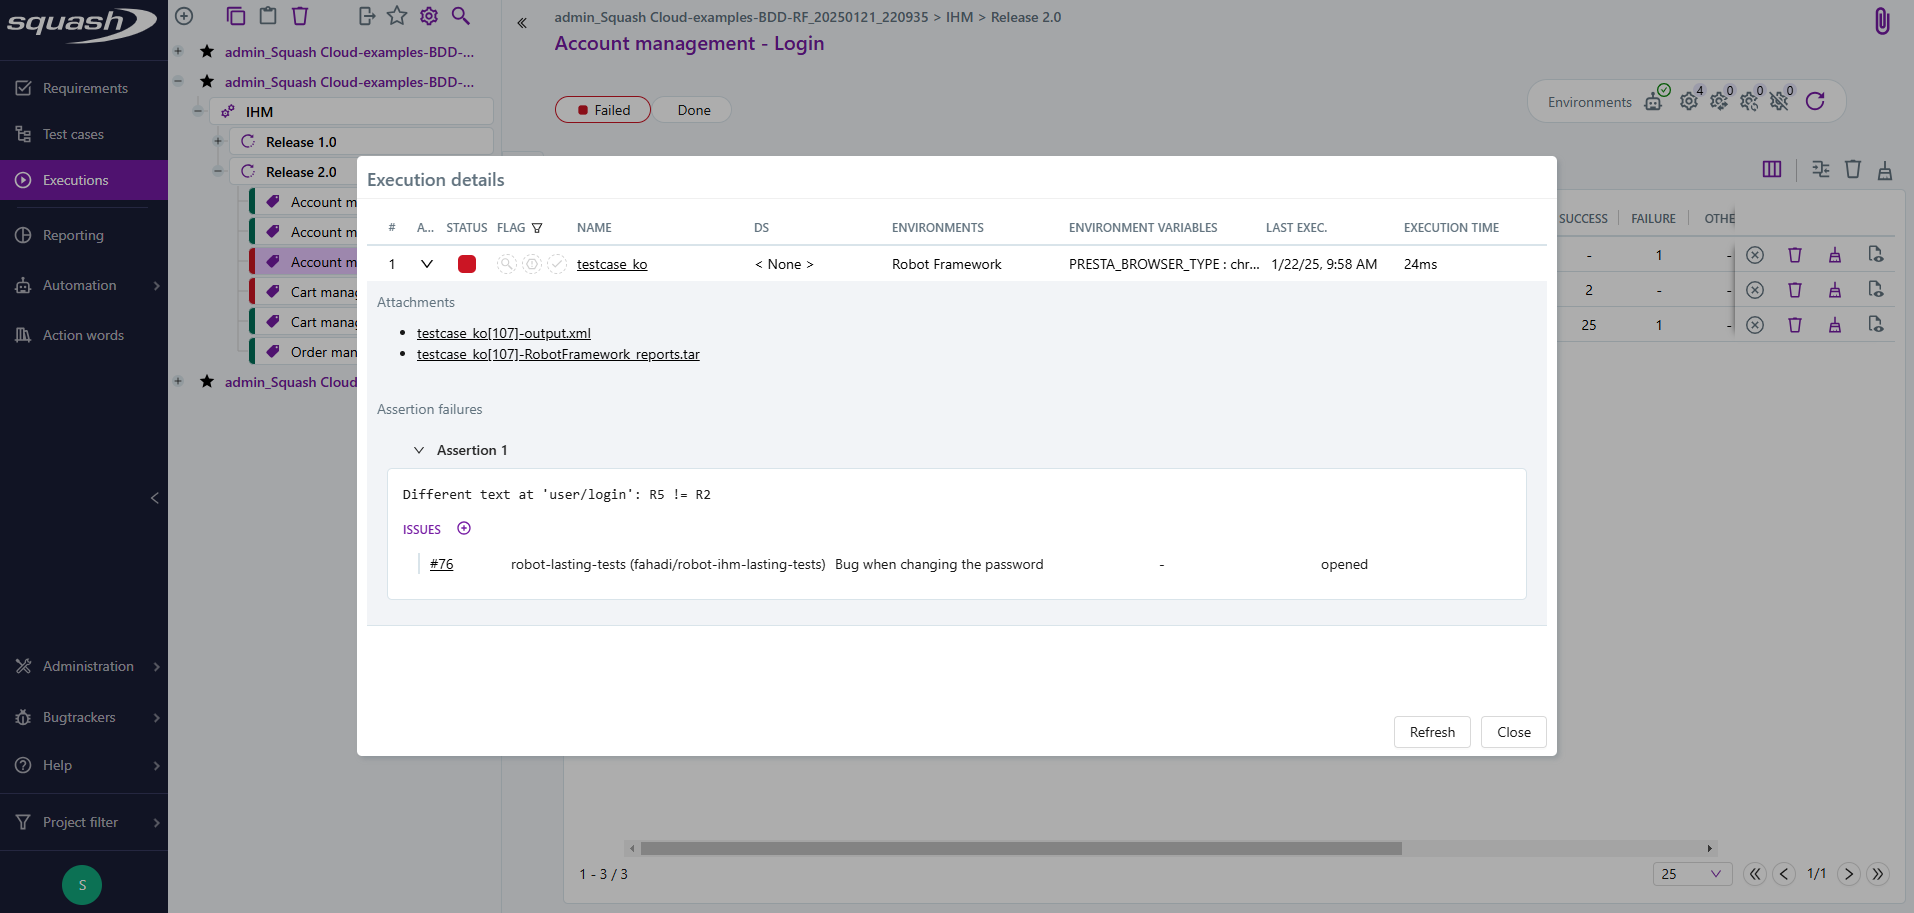
When an issue is linked to an assertion failure, it is also linked to the execution where the action was performed, as well as to all subsequent executions with the same assertion failure.
When an issue is unlinked from an assertion failure:
- Executions carrying the assertion failure remain linked to the issue.
- Future executions carrying the assertion will no longer be linked to the issue.
Execution indicator
Info
This feature is available with Squash Premium 👑 and Squash Ultimate 💎 licenses, using the Squash TM Premium plugin.
UFT
The automatic calculation of the indicator for UFT is not supported. The indicator can be used in manual mode.
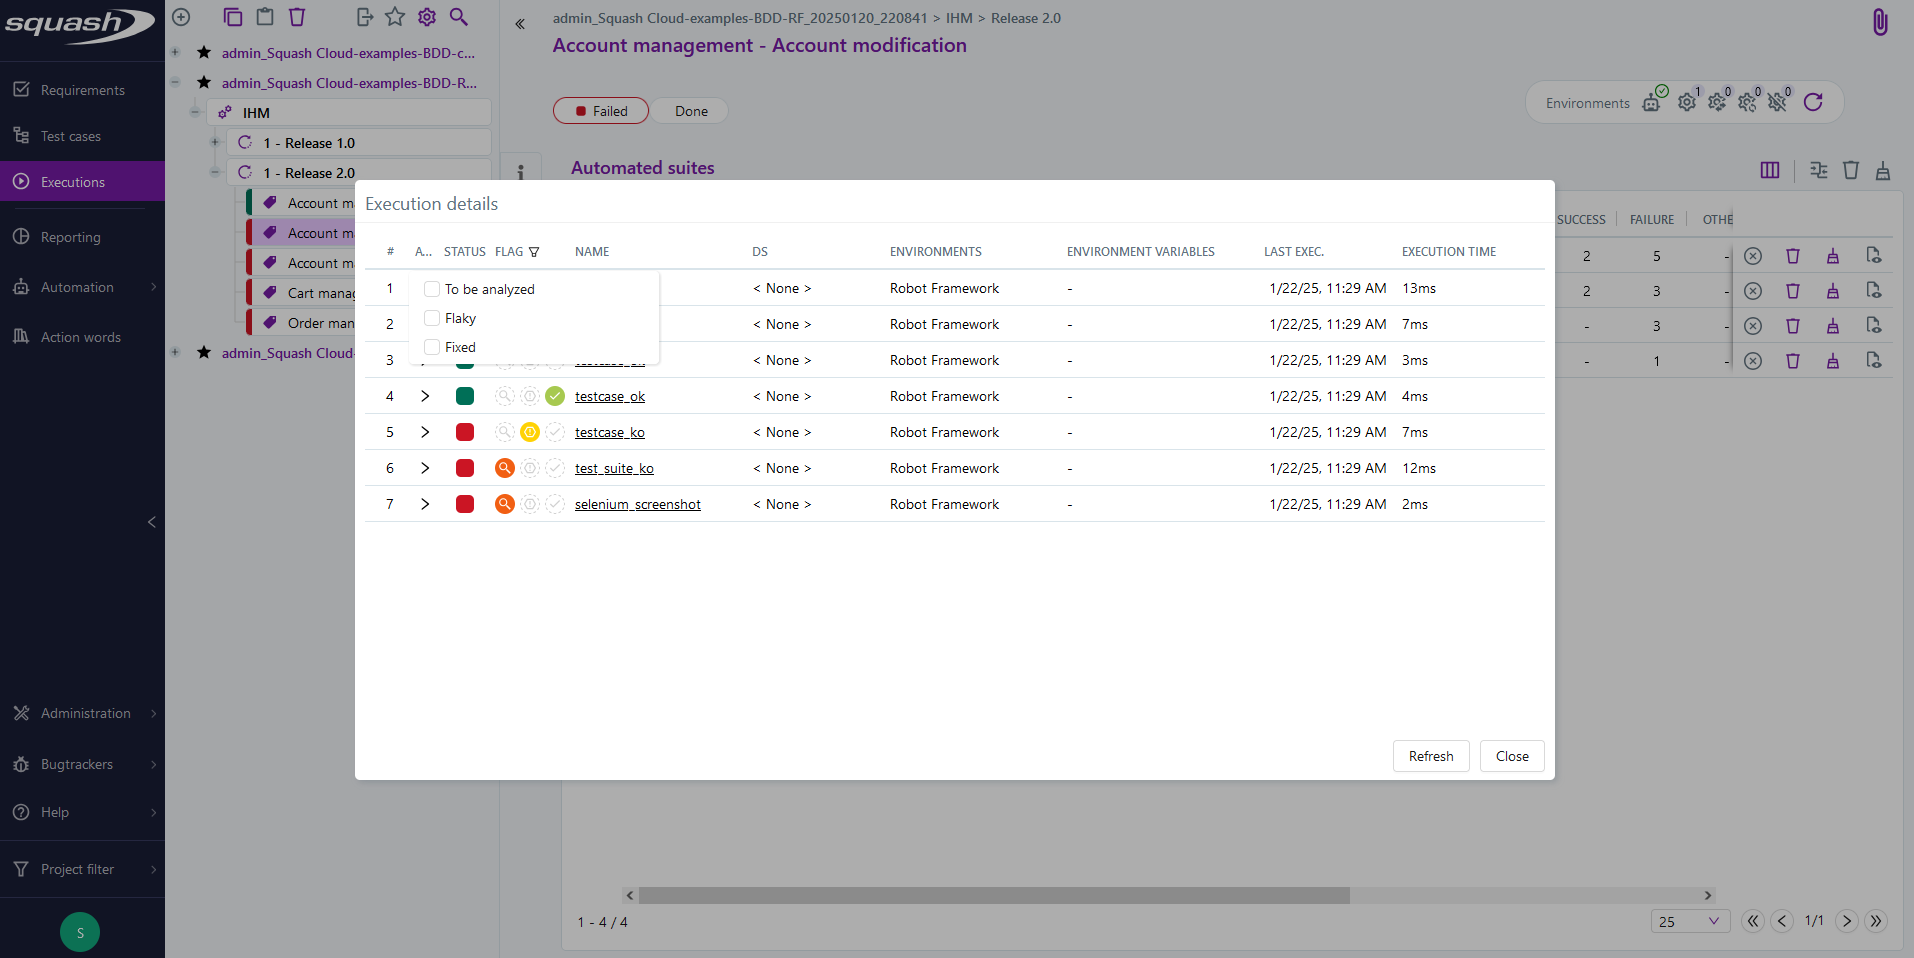
Three types of indicators have also been added to speed up the analysis phase:
| Indicator | Icon | Description |
|---|---|---|
| To be analyzed |  | A failed test whose cause of failure is unknown will be indicated as 'to be analyzed', unlike a test that already has a linked anomaly. |
| Flaky |  | A test that oscillates regularly between success and failure without a linked anomaly will be indicated as 'flaky'. |
| Fixed |  | A successful test whose previous execution failed but with at least a linked anomaly, will be indicated as 'fixed'. |
These indicators can be used to quickly highlight that an action is required, whether it's an anomaly creation, a script maintenance, an anomaly closure, etc.
There can be only one active indicator at a time for each execution. Indicators can be activated or deactivated by clicking them manually.
'To be analyzed' indicator
The 'To be analyzed' indicator is automatically activated if a test has a 'failure' status and no anomaly is linked to the assertion failure. In the case of multiple assertion failures in a test, if at least one assertion has no linked anomaly, the indicator will be activated. If all assertion failures are related to anomalies, the indicator is deactivated. If a linked anomaly is removed or an action marks the analysis as incomplete, the indicator will be reactivated.
'Flaky' indicator
The 'Flaky' indicator is automatically activated if a test alternates between passing and failing at least twice within the last ten executions, and no anomaly is linked to the relevant assertion failures.
'Fixed' indicator
The 'Fixed' indicator is automatically activated if a test has a 'success' status in its latest execution but had a 'failure' status in the previous execution, with an anomaly linked to at least one of the assertion failures.
Indicator Filters
Filters allow displaying executions with the selected indicators.
Viewing the Execution Statuses of BDD Test Steps
Info
This feature requires Squash Orchestrator version 4.11.0 (delivery 2024-05) or later to function.
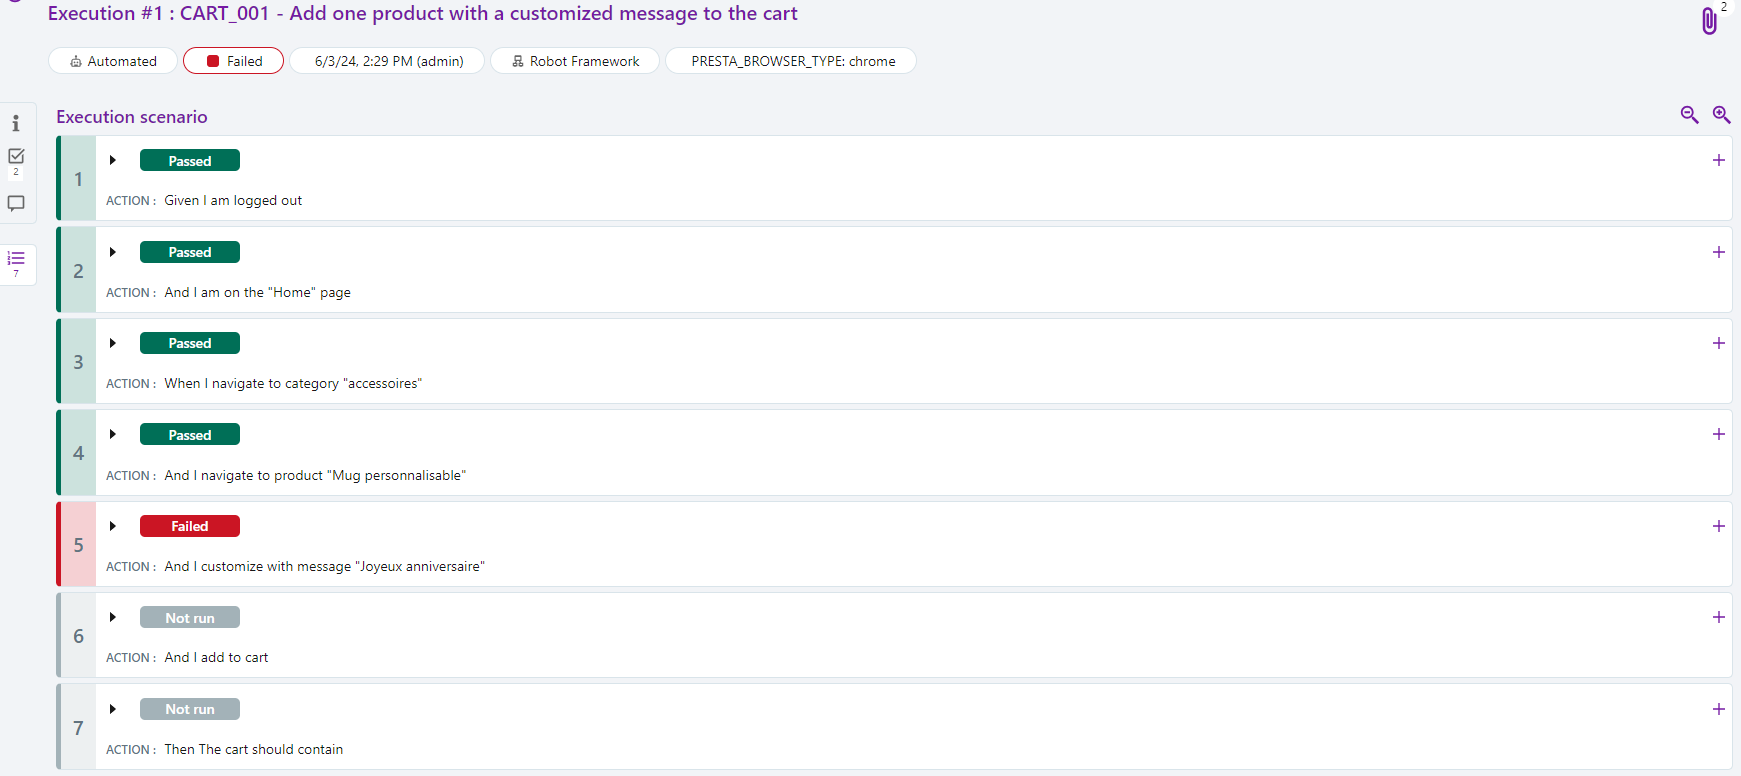
You can view the execution statuses of the test steps from a BDD test execution (Robot Framework or Cucumber) directly from the Execution Scenario anchor of an execution.
Warning
The execution status of test steps will not be updated and will remain "Ready" if the number of test steps in Squash differs from the number of steps in the XML execution report (e.g., if some test steps are missing in the XML report).
The equivalences between the test step statuses and the Squash statuses are as follows:
| Squash Status | Cucumber | Robot Framework |
|---|---|---|
| Passed | passed | PASS |
| Failed | failed | FAIL |
| Skipped | skipped | SKIP |
| Not run | - | NOT RUN |
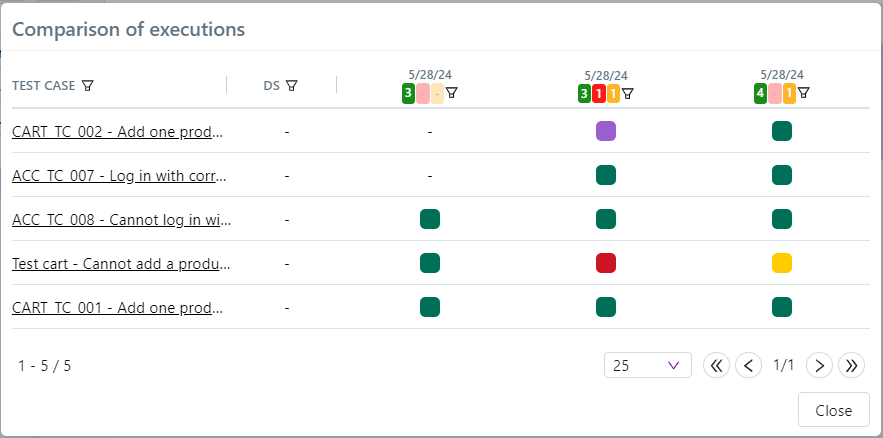
Comparing Execution Statuses
Warning
Comparing execution statuses is a feature available with the Squash Premium license and the Squash TM Premium plugin.
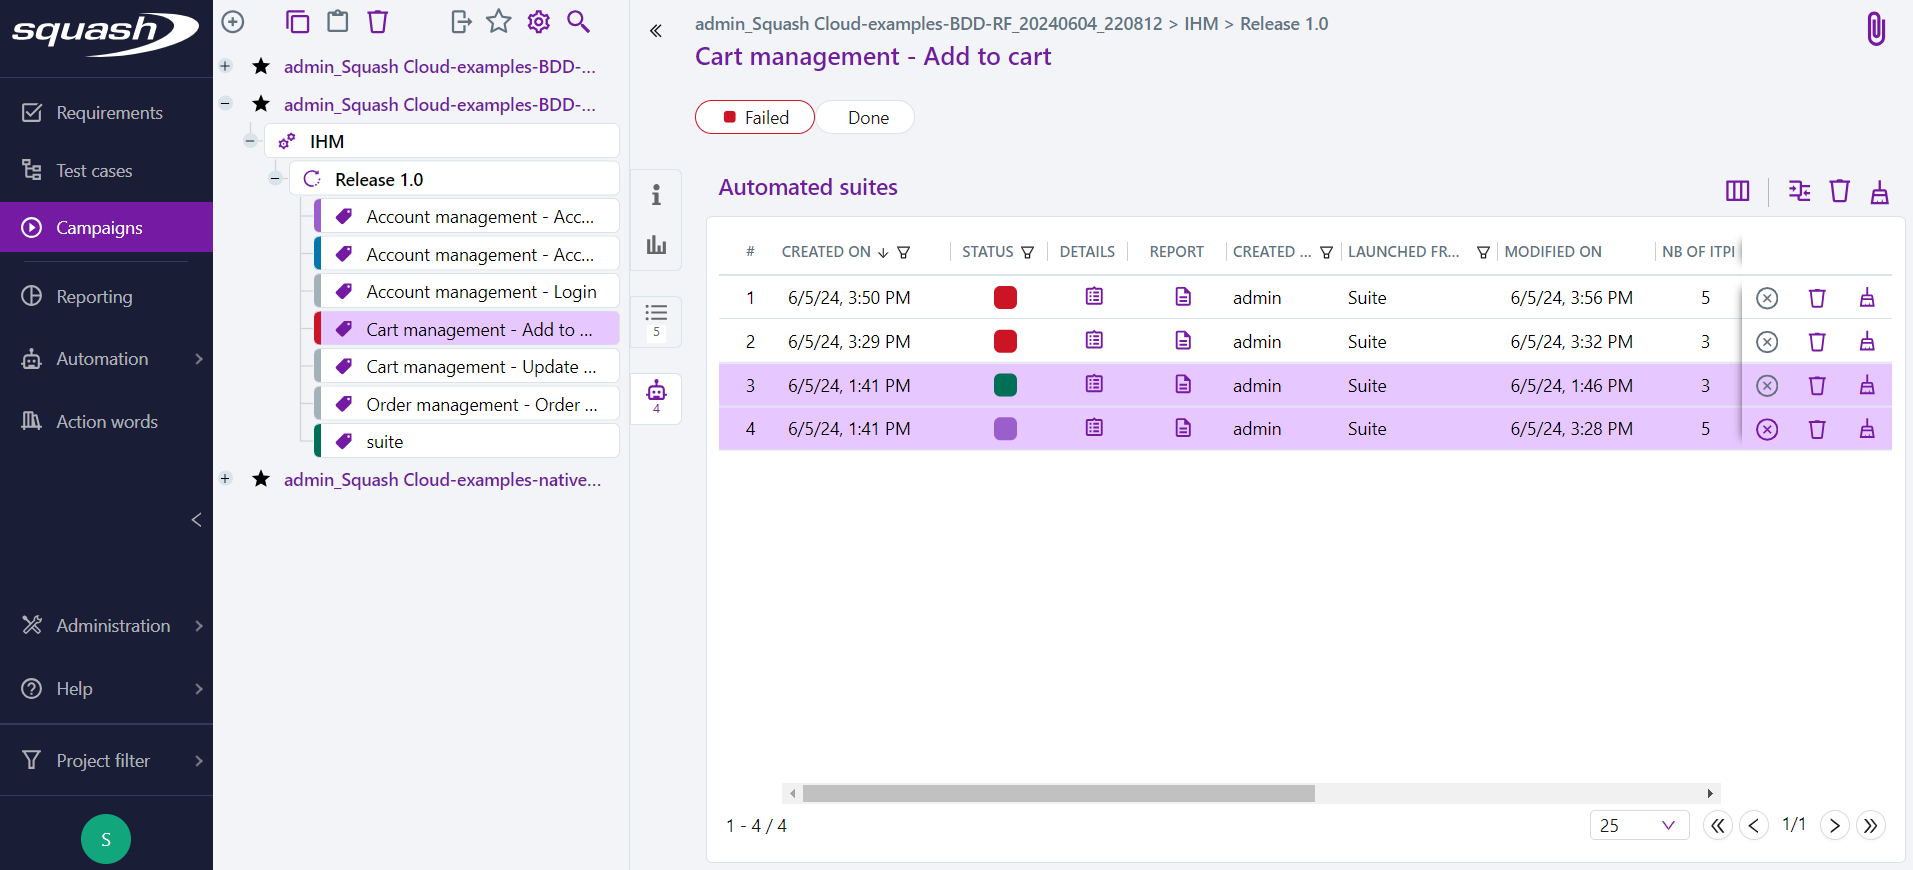
It is possible to compare the detailed execution statuses of test plan items from multiple automated suites.
To compare, select at least two automated suites, then click on the icon ![]() .
.
The automated suites comparison pop-up contains a table with one row per test plan item and one column per automated suite.
The suites are sorted by selection order, and the columns can be filtered and sorted by execution status.