Custom Dashboards
Create a Custom Dashboard
A custom dashboard enables you to display multiple custom charts and reports on the same page.
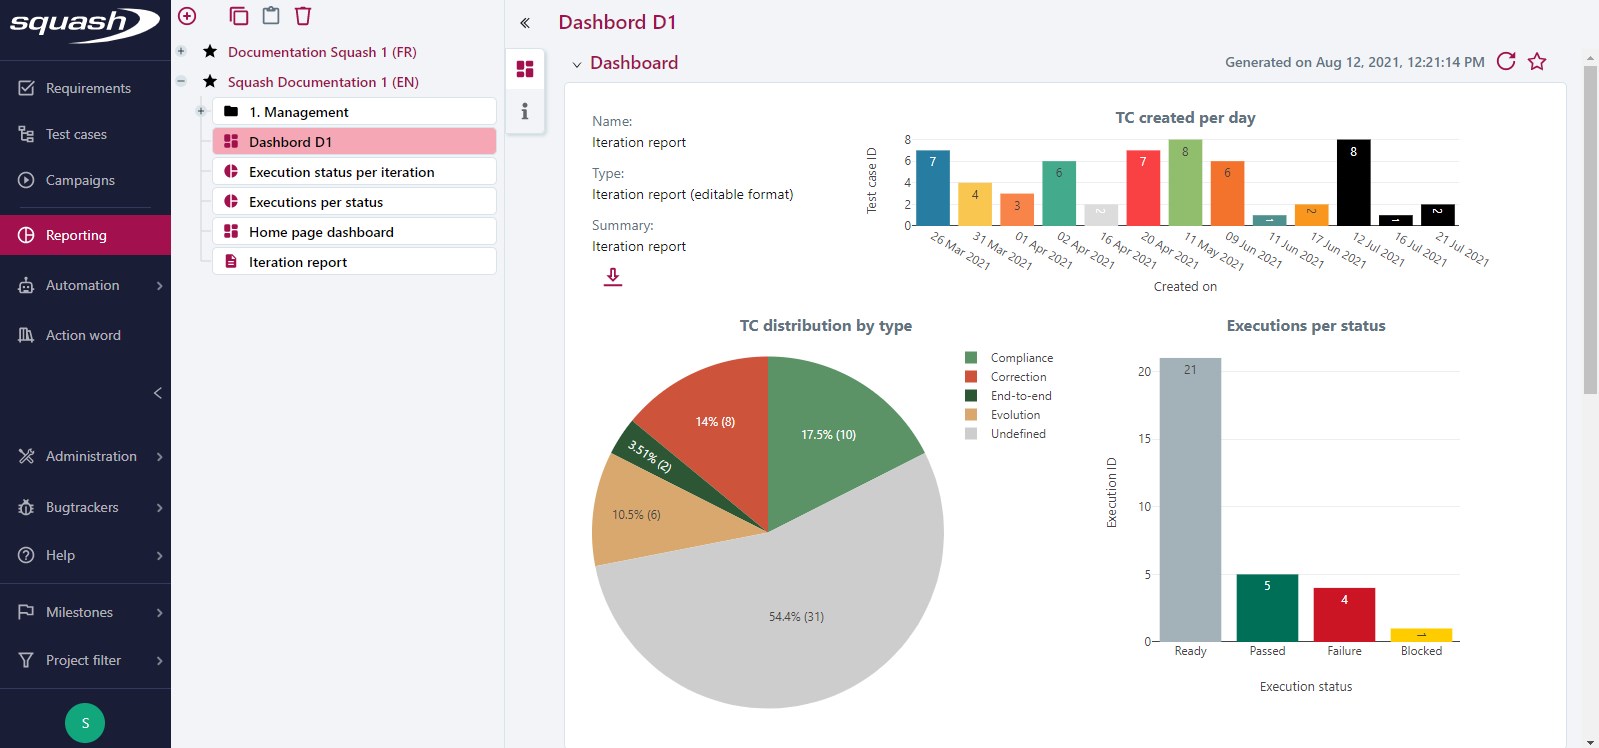
You can generate a custom dashboard from the Reporting workspace by clicking on the button  then on 'Add custom dashboard'.
Then, you can drag and drop charts and reports from any project to your dashboard.
You can download added reports directly from your dashboard.
A dashboard can contain a maximum of 12 items. By default, the dropped item's size will be 1/12 of the dashboard's and it will be placed on the available most top left position.
Info
To improve your viewing of the charts, we recommend that you increase their size so it is at least 2/12 of the dashboard's.
It is better to adapt your chart's size according to the data it contains.
To change the positionning of the items in your dashbaord:
- Drag and drop the item to the desired spot on the dashboard
- Use the gray icon
 in the angle on the bottom right to increase or dimisish an item's size
 - If item (1) selected in the tree is dropped on item (2) in the dashboard, then item (2) is replaced by item (1), and no longer displayed on the dashboard.
- You can invert two charts if they are the same size
A grid appears to help you resize and place items.
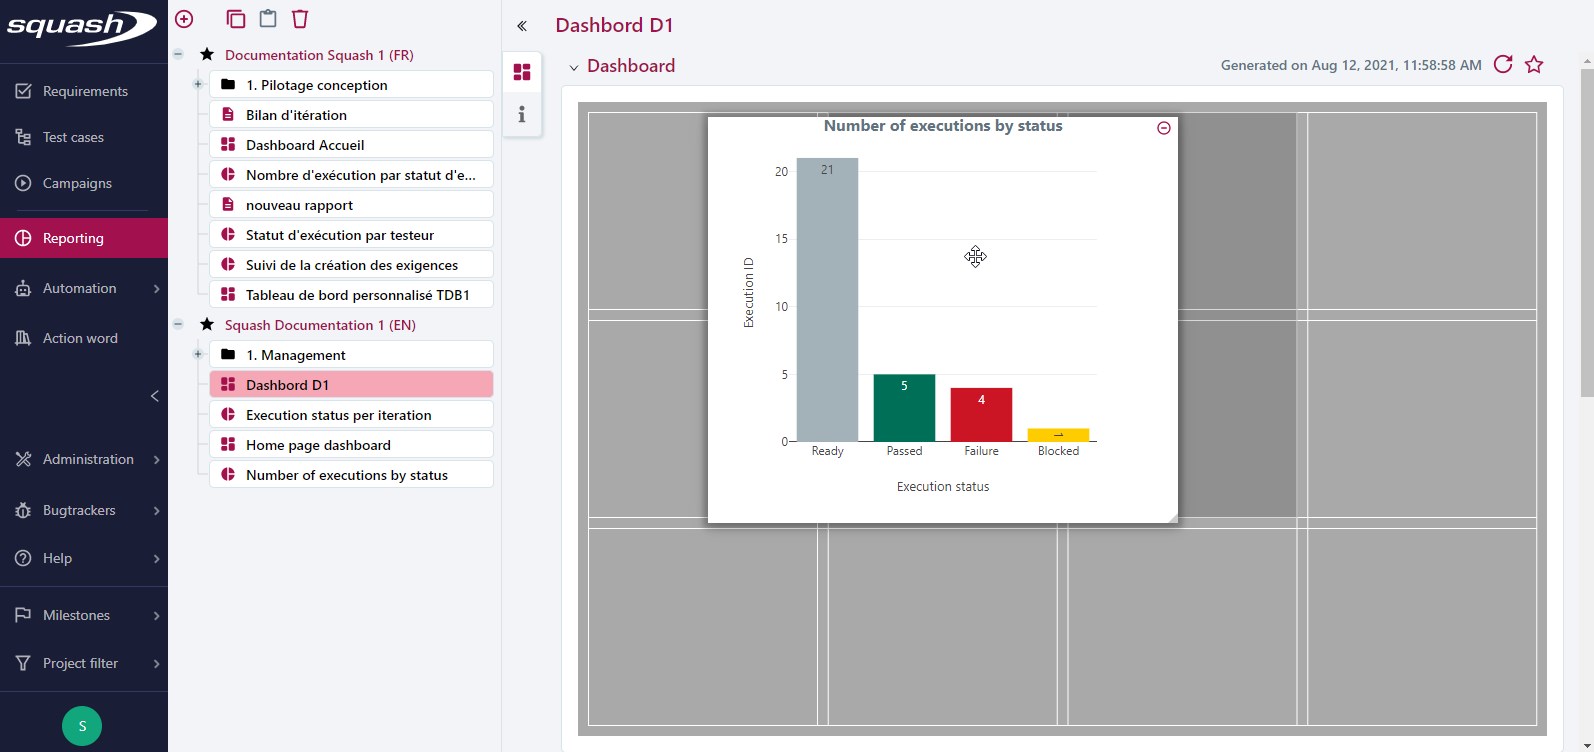
To delete a dashboard item, hover over it and click on the button  on the top right.
Select and Display Your Favorite Custom Dashboard
On a dashboard's consultation page, the button  enables you to display it in different workspaces within the app:
- Homepage
- Requirement workspace
- Test Case workspace
- Campaign workspace
You can dislpay a dashboard in multiple workspaces. To stop displaying the dashboard as a favorite, unselect the workspace or select the option "No workspace".

Info
A favorite dashboard changes according to each user.
Once a dashboard is selected for a workspace, you can display it from every project of that workspace.
Display your Favorite Dashboard in the Workspaces
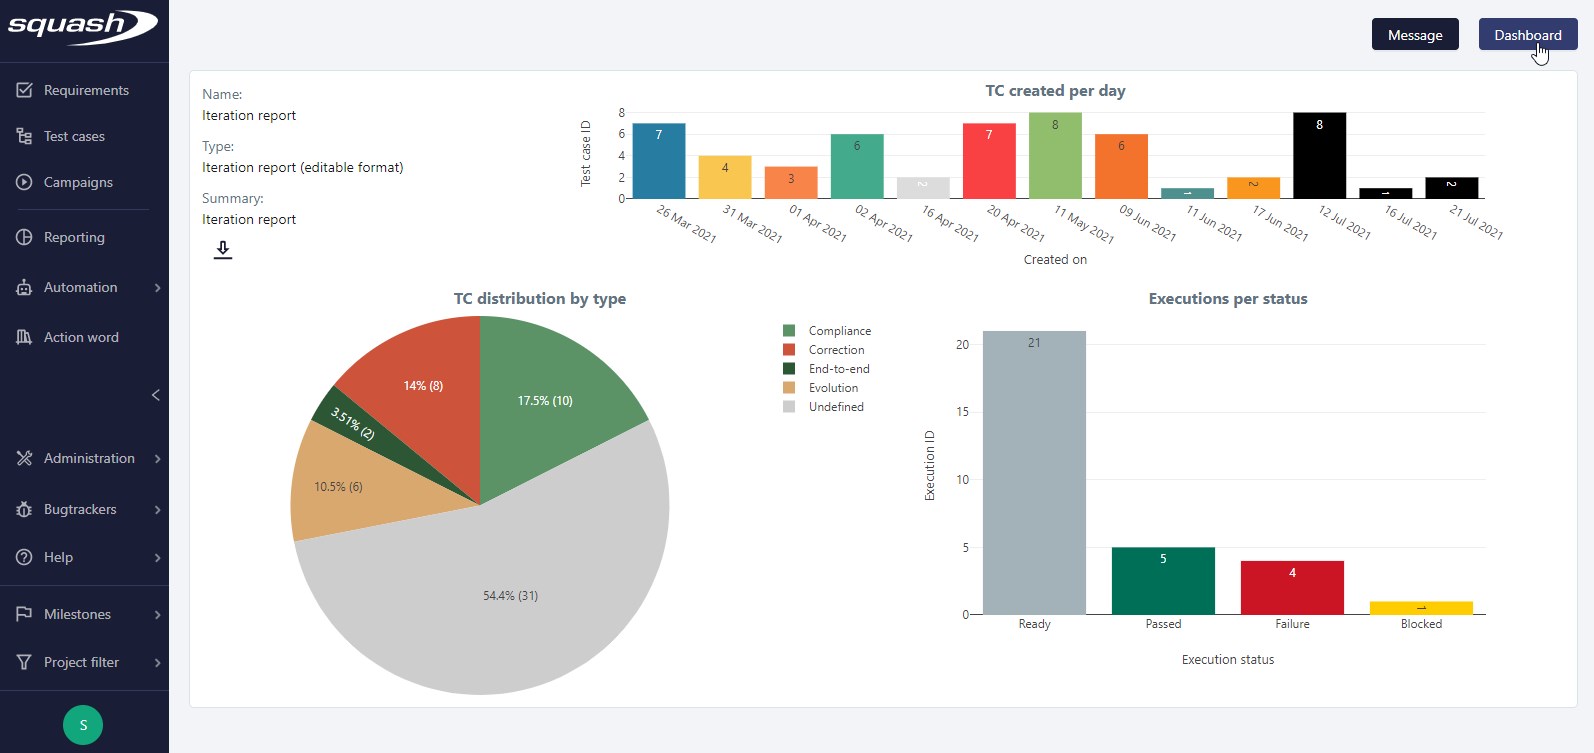
To display your favorite dashboard on your Squash TM homepage, click on the button [Dashboard] on the top right of the page.
On the homepage, the dashboard has the same perimeter as in the reporting workspace.
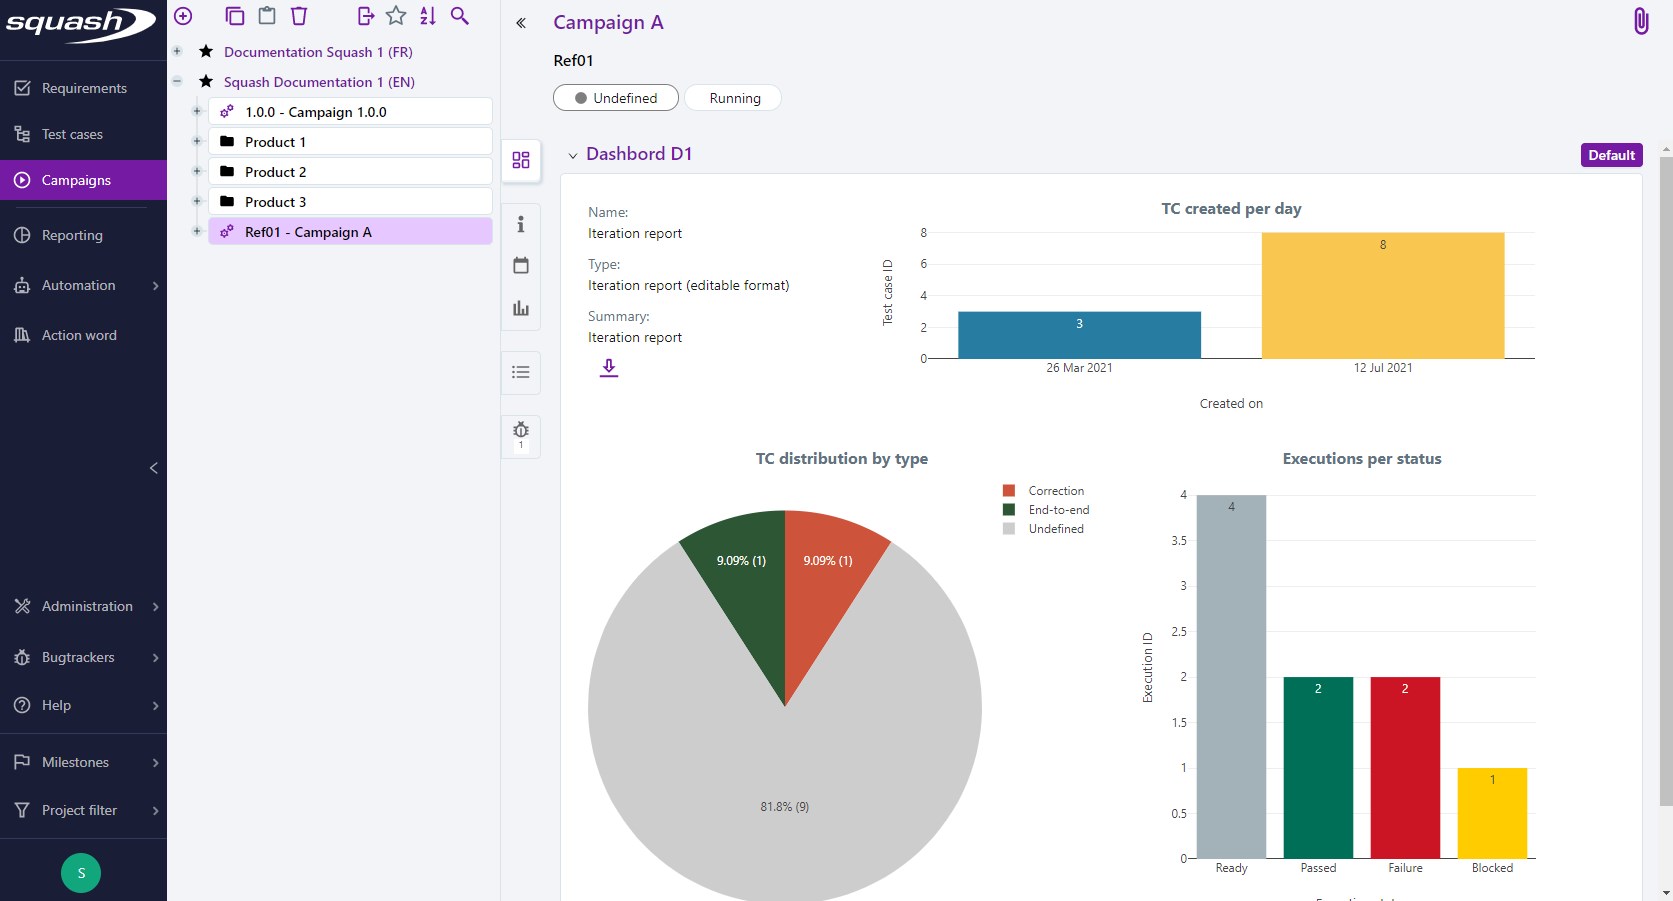
To display your custom dashboard in the Requirement, Test Case, and Campaign workspaces, click on the button [Favorite] on the top right of the "Dashboard" block.
To reselect the default dashboard, click on the button [Default] to display it
Info
Custom dashboard charts adjust themselves to what you have selected in the workspace's tree no matter the chart perimeters in the Reporting workspace.