Requirements Dashboards
In the requirements library, a dashboard appears on the consultation page when selecting items. You can display either a default dashboard or a custom dashboard by clicking on the buttons [Favorite]/[Default]
Info
The dashboard automatically appears when you select a project or folder.
When you select multiple items (projects, folders, requirements), you must refresh the dashboard to display it.
En savoir plus
To know more about custom dashboards, please visit the page Custom dashboards
Charts
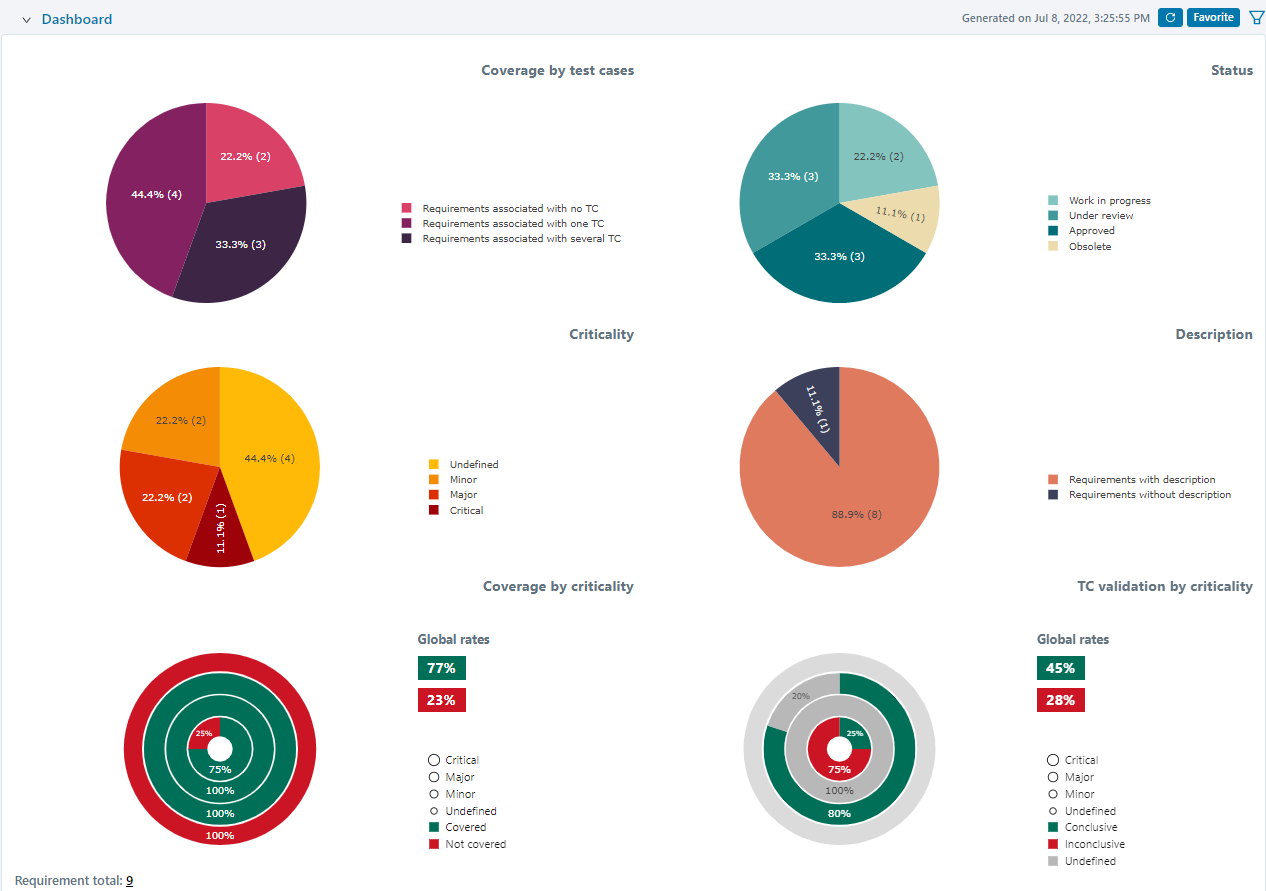
The charts default dashboard contains 6 charts:
- Chart 'Coverage According to Test Cases'
Requirements are divided according to whether they are related to none, one, or several test cases. This chart is very useful to verify the functional coverage of the app and it allows you to identify the requirements that are not covered by test cases.
- Chart 'Status'
Requirements are divided according to their progress. This chart allows you to have an overview of the requirements' progress.
- Chart 'Criticality'
Requirements are divided according to their criticality.
- Chart 'Description'
Requirements are divided according to whether or not they have a description. This chart allows you to quickly identify the requirements that do not have a description so you can complete it. As a reminder, a requirement's description matches one specificity of the app. It is essential for writing tests.
- Chart 'Coverage According to Criticality'
Requirements are divided according to their criticality and test cases coverage. This chart allows you to prioritize the redaction of the test cases that must verify the most critical requirements.
- Chart 'Test Cases Validation According to Criticality'
Requirements are divided according to their criticality and the validation rate of the test cases they are linked to. This chart allows you, for example, to know if every critical requirement has been validated following the execution of the linked test cases.
Accessing the Search Page
When clicking on part of a default dashboard's chart, a search page appears along with the preselected criteria corresponding to that part of the chart.
For example :
When clicking on the "Requirements linked to no TC" part of the "Coverage by test steps" chart, a search page appears with the criteria "Number of test cases: Equal 0".
By clicking on the button  or the button
  you can directly modify the test case, and link at least one test case to each requirement.
Info
This feature is not available for custom dashboards.
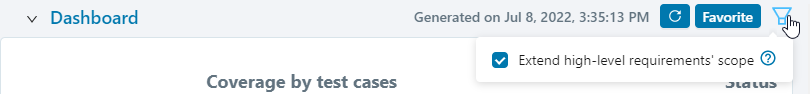
Extending high-level requirements' scope
In the default and custom dashboards, an option enables you to extend the high-level requirements' scope. This way, the linked standard requirements are included in the dashboard, even if they do not fit in the initial perimeter.
Learn more
To learn more about high-level requirements, visit the page Manage high-level requirements