Follow testing activity in Jira
In Jira, testing activity can be tracked in real time for each sychronized Jira issue. The following information is available:
- user stories coverage and validation indicators
- details of test cases and executions covering the user stories
Coverage indicators
The Xsquash4Jira plugin is able to transfer information related to testing activity from Squash TM to Jira. It allows the entire team to track coverage and execution progress and user stories validation directly in Jira.
This information is reported in Jira issues, with each synchronization cycle, more precisely in the custom fields especially configured for this purpose.
Learn more
To learn more about coverage indicators configuration, visit the page Configure the Reporting from Squash to Jira
When reporting fields are correctly configured in Jira and entered correctly in Squash TM, Xsquash4Jira automatically completes these fields during synchronizations and updates if needed.
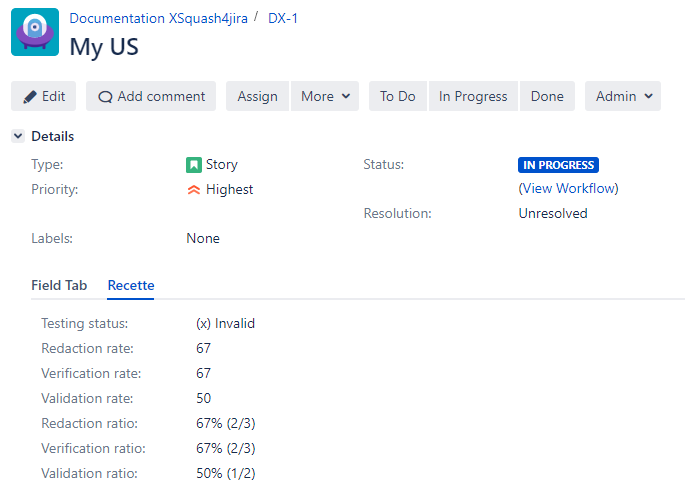
Seven fields are available, they are detailed below.
Redaction Rate
This rate enables you to see the progress of the test case redation. For a synced requirement, this rate is equal to:
Number of test cases covering the requirement or one of its children with the status "Under review" or "Approved" / Number of test cases covering the requirement or one of its sub-requirements no matter their status.
If a requirement is not covered, this rate equals 0.
Redaction Ratio
This field uses the value of the redaction rate followed by the numbber of relevant test cases (X/Y test cases).
Verification Rate
This rate enables you to track the execution progress of the test cases linked to a requirement or one of its children. For a given synced requirement, this rate is equal to:
Number of ITPIs linked to a TC covering the synced requirement or one of its children with a final execution status (Blocked, Failed, Untestable, Passed, Settled), only taking into account the last execution (or last fast pass) / Number of ITPIs linked to test cases covering the synced requirement or one of its children
Verification Ratio
This field re-uses the value of the verification rate followed by the number of test cases involved (X/Y test cases).
Validation Rate
This rate enables you to track the validation of a requirement. For a synced requirement, this rate is equal to:
Number of ITPIs linked to a TC covering the synced requirement or one of its children with a validated execution status (Passed or Settled), only taking into account the last execution (or last fastpass) / Number of ITPIs linked to a TC covering the synced requirement or one of its children with a final execution status, only taking into account the last execution (or last fast pass)
Validation Ratio
This field re-uses the value of the validation rate, followed by the number of test cases involved (X/Y test cases).
Testing Status
It's a synoptic field that summarizes the different possible testing statuses for a given requirement.
The calculation method is as follows:
| Writing Rate | Verification Rate | Validation Rate | Testing Status |
|---|---|---|---|
| 0 | 0 | 0 | Not initialized |
| 0 < Writing Rate < 100 | 0 | 0 | Design in progress |
| 100 | 0 | 0 | To execute |
| All | 0 < Verification Rate < 100 | 100 | Execution in progress |
| All | 0 < Verification Rate | Validation Rate < 100 | Not validated |
| All | 100 | 100 | Validated |
You can display only this field in Jira if it was configured separately. The rates will be calculated but not transmitted to Jira.
Focus
The fields "rates" and "ratios" contain similar information. Therefore, it is useless to synchronize all of them, and more interesting to choose only one of the two.
La différence se fait sur la forme. Les champs "taux" renvoient un nombre simple compris entre 0 et 100.
Les champs "ratio" reprennent dans une chaîne de caractères le nombre remonté dans le taux avec le symbole % suivi du nombre de tests concernés (X/Y tests).
Test cases and executions details
In Jira, it is also possible to view test cases and executions details for each synchronized issue. It allows the product owner, scrum master and developer to see what is or what is not tested and which test cases are in passed or failed.
This information requires to install the Xsquash plugin on Jira.
Learn more
To learn more about Xsquash install and configuration, visit the page Configure Xsquash in Jira
One the configuration is done, Xsquash displays this information in two tabs on Jira issues:
- in the "Activity" section for Jira Server and Jira Data Center
- in a "Xsquash" section for Jira Cloud
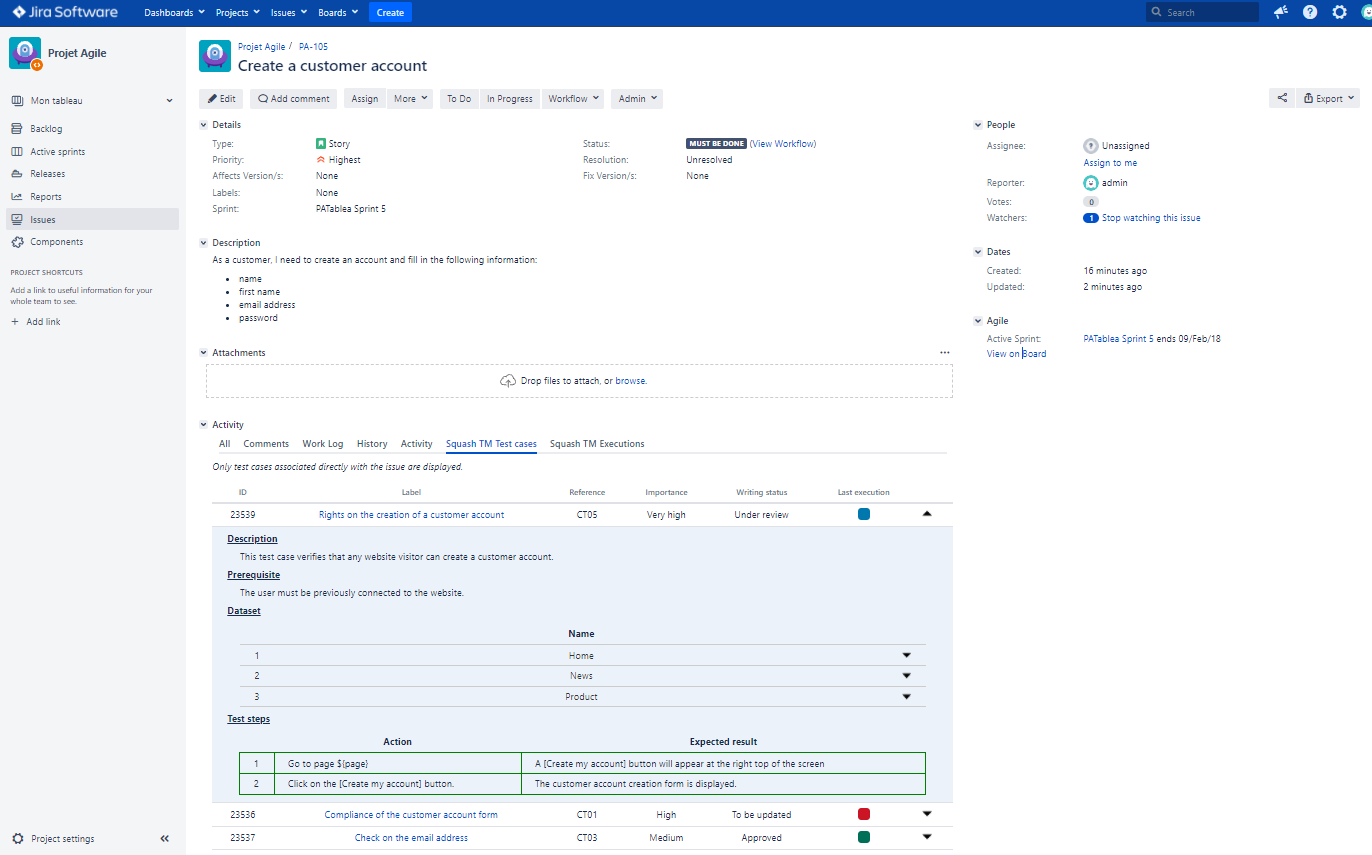
"Squash TM Test Cases" Tab
In the "Squash TM Test Case" tab, a table displays different information on the test cases related to the Jira issue.
In the table, by clicking on the button at the end of a test case's row, you can display extra information on the test case such as its description or test steps.
It is also possible to access the test case and execution in Squash TM through links.
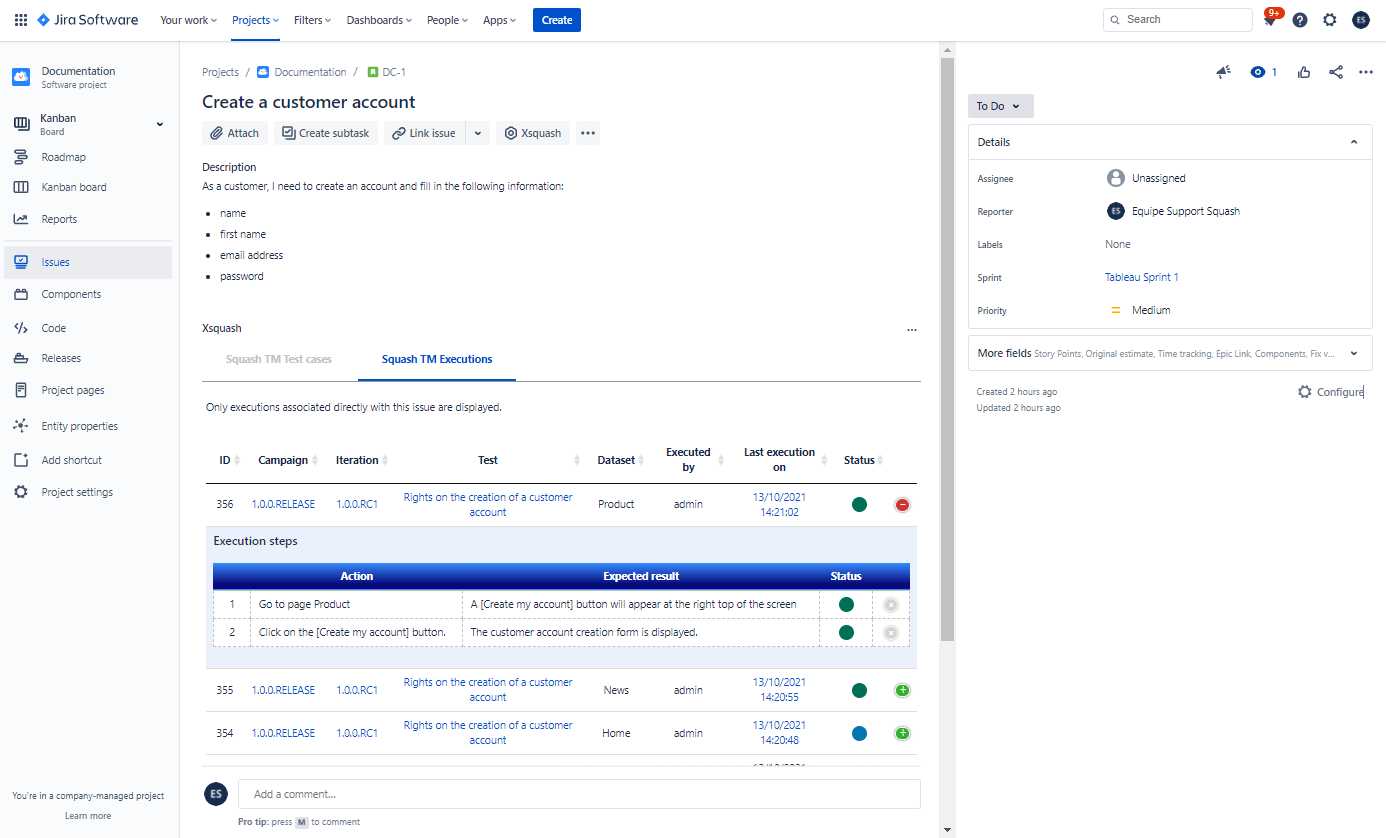
"Squash TM Execution" Tab
The "Squash TM Execution" tab displays a table with information related to the last execution of each execution plan item. Thus, if the test case is added to x execution plans, then the tab will display the last execution of these x occurrences.
In the table, by clicking on the button at the end of each row, you can display extra information on the last execution, such as the executed test steps, and execution steps comments.
It is also possible to access the campaign, iteration, test case and execution in Squash TM through links.
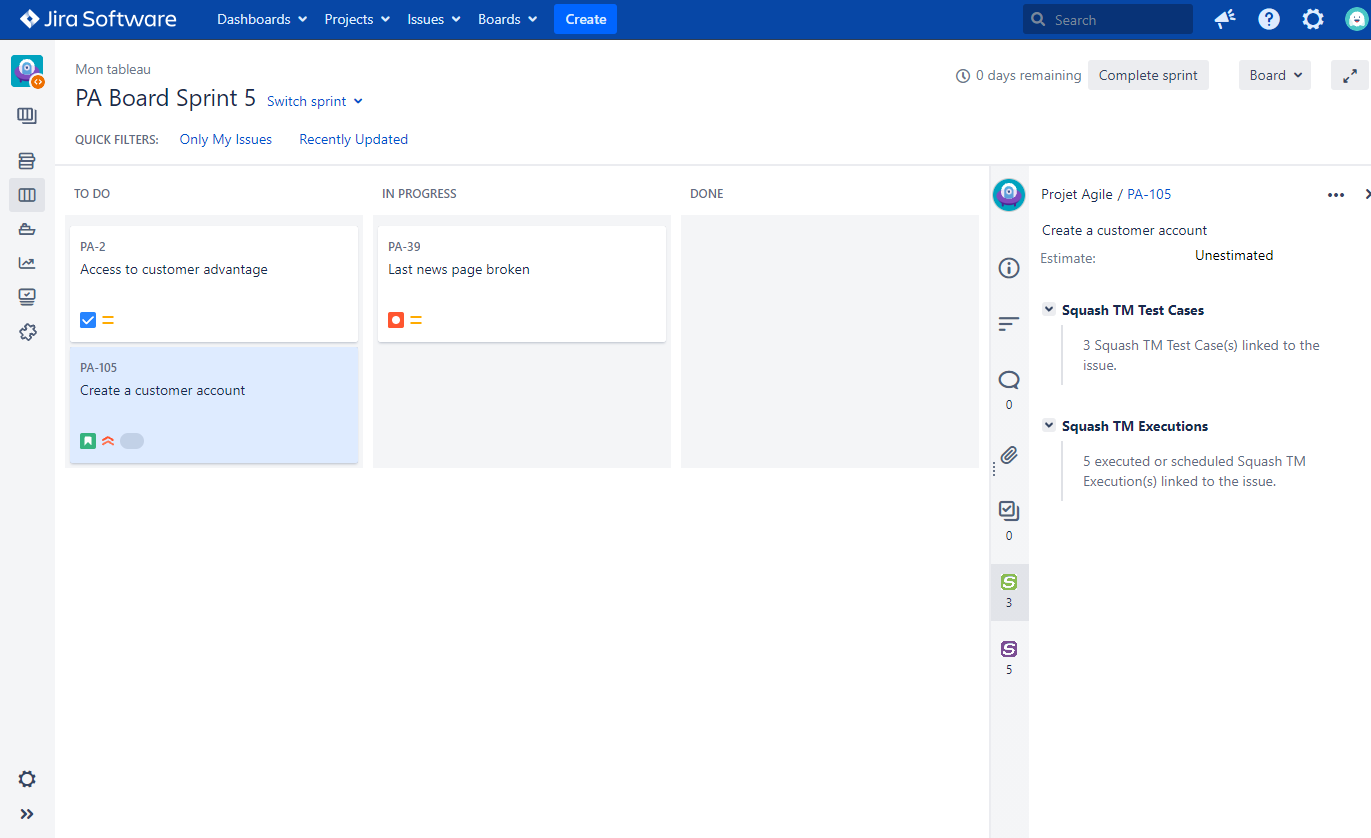
Quick Overview from a Table
In Jira Server and Jira Datacenter, from the Scrum and Kanban tables, you can get a quick overview of each request by clicking on their name.
From this overview, it is possible to view the number of test cases and executions linked to the issue.