Default dashboard
The dashboard in the Campaigns workspace facilitates the monitoring of the test cases execution phase. When an item is selected from the Campaigns space library, the first anchor displays the object's default dashboard and it adapts to the simple selection on an object.(Multiple selection of objects of the same hierarchy level doesn't generate a dashboard).
| Entity/ Dashboard item | Cumulative progress | Statisics | Test inventory | Scope |
|---|---|---|---|---|
| Folder | X | X | all campaings in the folder | |
| Campaign | X | X | X | all iterations in the campaign |
| Iteration | X | X | X | all ITPI, associated or not with a suite, in the iteration2 |
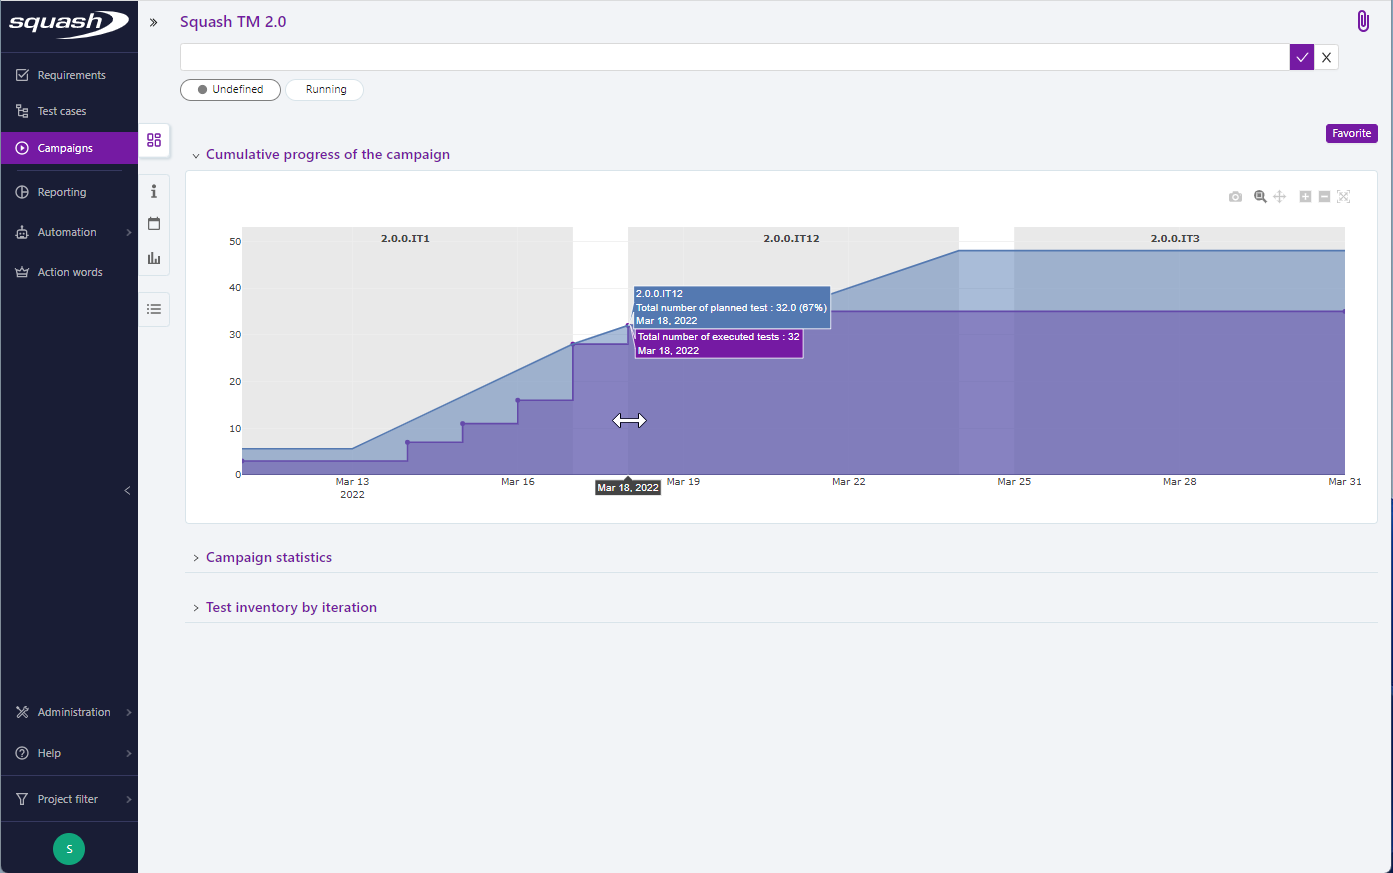
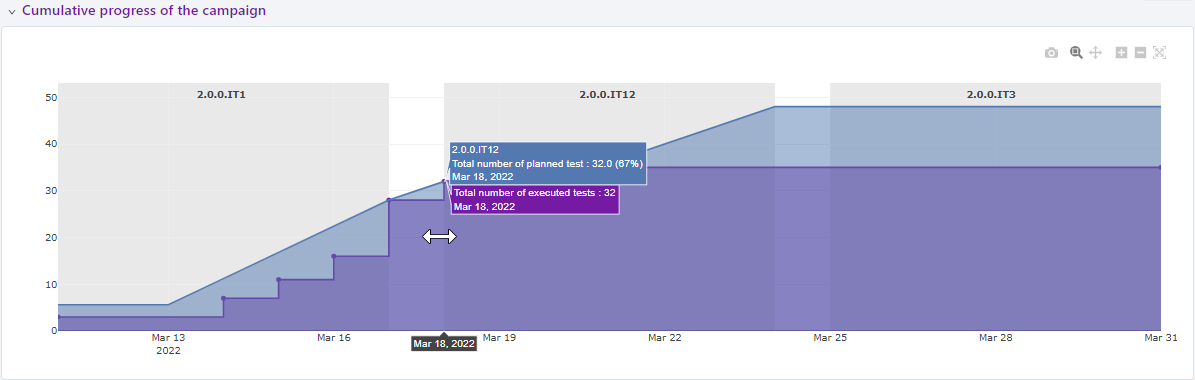
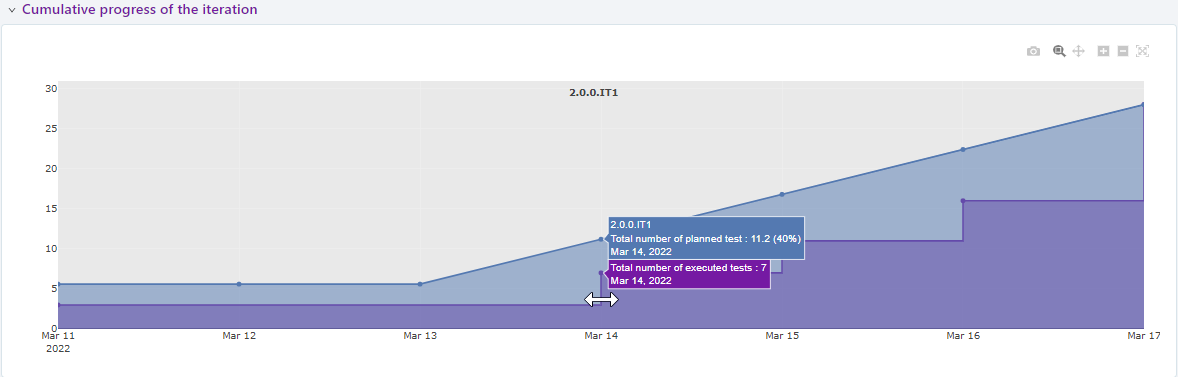
Cumulative progress
The Cumulative campaign progress graph is generated from the Cumulative iteration progress graphs. They are generated automatically from the dates given in the Scheduling block of the iteration. It is a graphical representation of the cumulative progress of the object taking into account the dates of the campaign, the iterations and the number of test cases to be done. The graph proposes a representation allowing to compare the achieved (purple curve) and the planned (blue curve) and thus to evaluate the cumulative progress of the campaign or the iteration.
Focus
The dates of two iterations must not overlap for the Cumulative campaign progress to be generated. The scope of the cumulative progress of a campaign is all the iterations that the campaign contains. The scope of the cumulative progress of an iteration is all items in its execution plan.
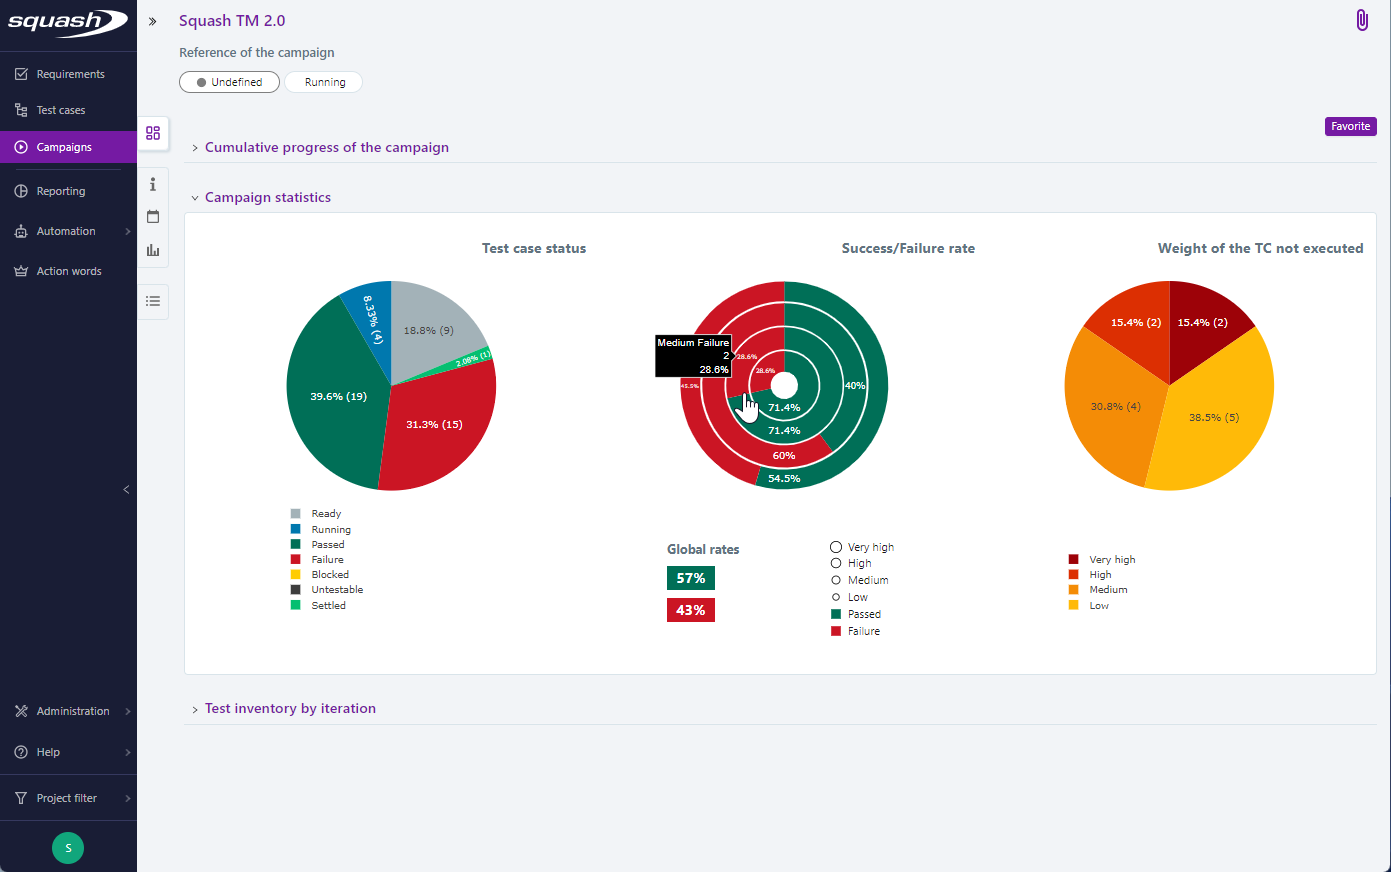
Statistics
The graphs in the Statistics block show the distribution of tests by execution status, the success or failure rate by importance of tests and the distribution by importance of tests never executed.
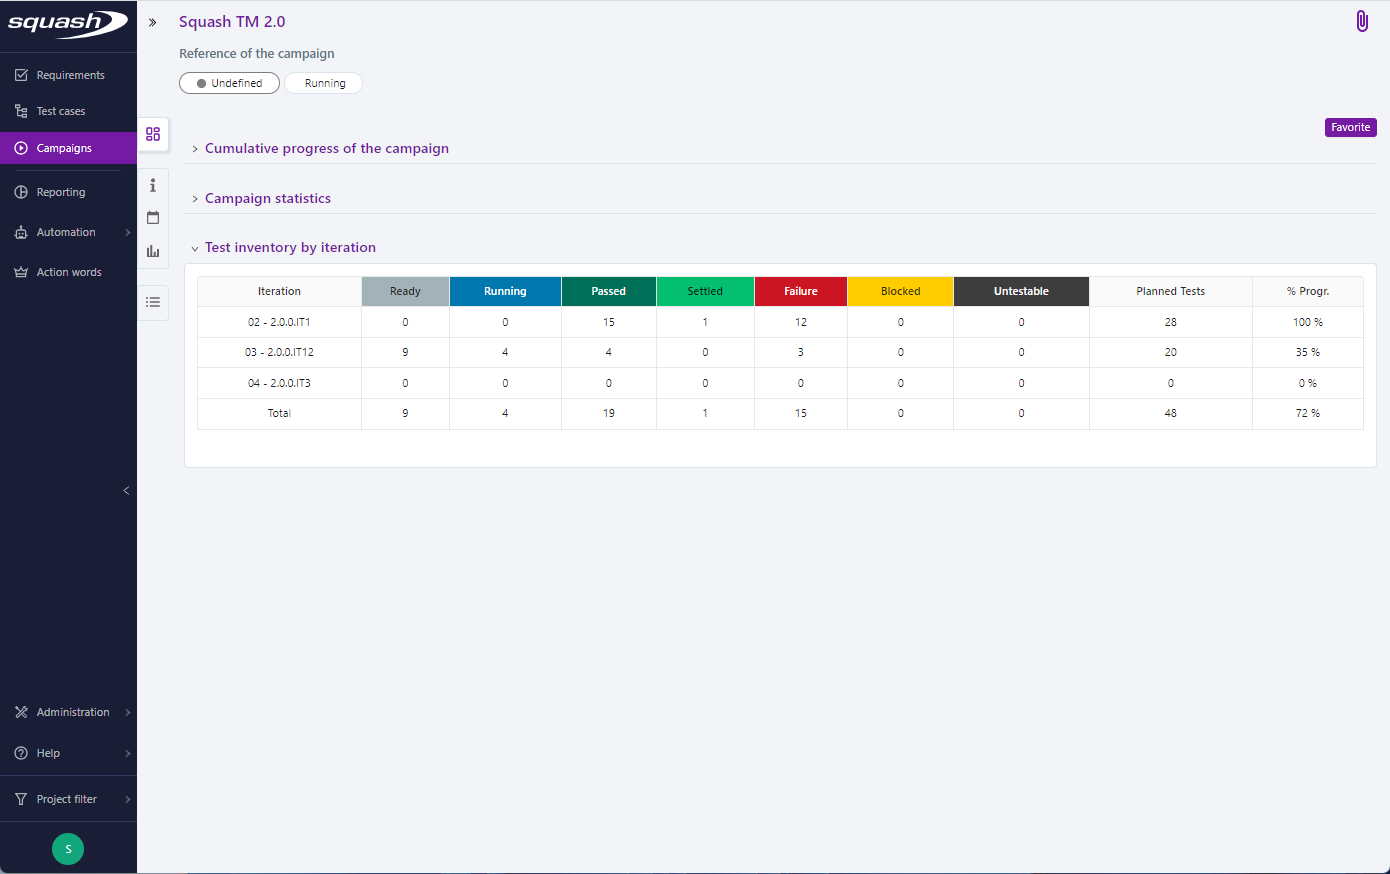
The Test Inventory block of a campaign is a distribution table counting the number of tests by execution status and by iteration