Synchronizations supervision
The anchor Synchronizations supervision  , accessible from the System submenu of the Administration workspace, lists on a single page and by block, information on all existing Xsquash4Jira, Xsquash4Gitlab, and Jira Automation Workflow synchronizations on the instance.
A "Project leader" profile can also view the synchronizations of his/her projects.
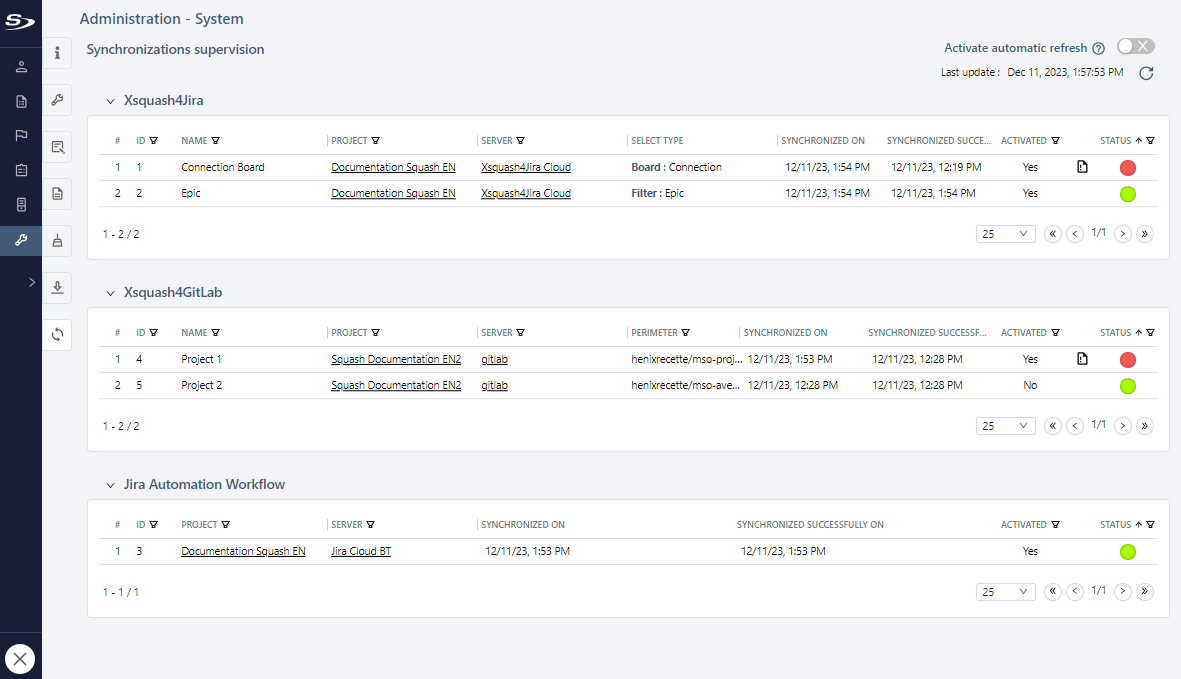
Each table displays the following information for each synchronization:
- the ID identifying the synchronization in the application logs;
- the Name of the synchronization;
- source Project: clickable link to the project's Plugins anchor;
- Server used: a clickable link to the server consultation page;
- Select type for Xsquash4Jira synchronizations: board, filter or JQL query, as defined when the synchronization was created;
- Perimeter for Xsquash4Gitlab synchronizations: as defined when the synchronization was created;
- Synchronized on: last synchronization date;
- Synchronized successfully on: date of last synchronization in 'Success';
- Activated: set to 'Yes' or 'No', depending on whether the switch button on the synchronization or plugin is active or not;
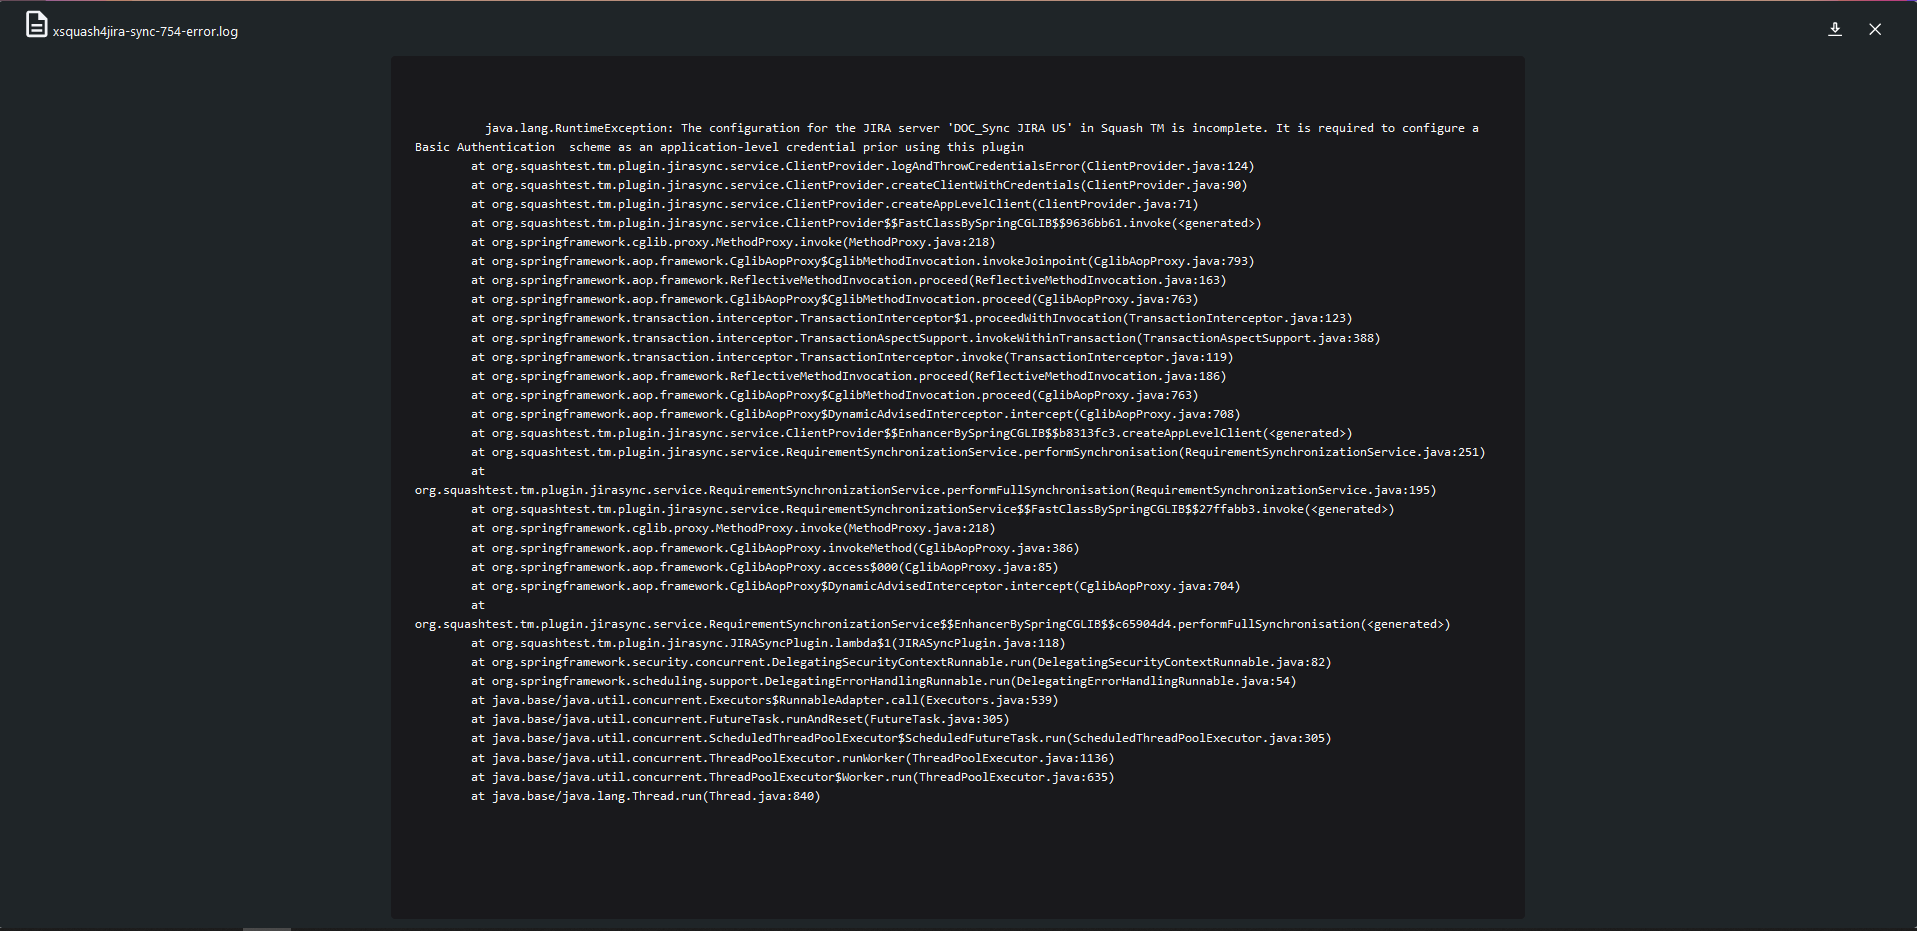
- the
.logfile tracing the synchronization error when 'Failed'; - the req. ratio indicates the number of successfully synchronized requirements versus the total number of synchronized requirements;
- the sprint ratio indicates the number of successfully synchronized sprint tickets versus the total number of synchronized sprint tickets;
- synchronization Status. Each table is sorted by default on this column in this order: 'Failed' (red icon)> 'Never synchronized' (gray icon)> 'In progress' (blue icon)> 'Successful' (green icon).
For each 'Failed' synchronization, a log file is available for preview and download. It contains the error specific to the synchronization in order to facilitate resolution.
The switch button, when activated, or the  button located above the tables, can be used to refresh data automatically or manually, without losing any applied filters or sorting.