Campaign dashboard
The dashboard in the Execution workspace facilitates the monitoring of the test cases execution phase. When one or multiple items are selected from the Execution workspace library, the first anchor displays the object's default dashboard and it adapts to the selection.
| Entity/ Dashboard item | Cumulative progress | Statistics | Test inventory | Scope |
|---|---|---|---|---|
| One or multiple Projects | X | X | all campaigns in the projects | |
| One or multiple Folders | X | X | all campaigns in the folders | |
| One Campaign | X | X | X | all iterations in the campaign |
| Multiple Campaigns | X | X | all iterations in the campaigns | |
| Iteration | X | X | X | all test plan items, associated or not with a suite, in the iteration |
| Iterations | X | X | all test plan items, associated or not with a suite, in the iterations | |
| Projects + Folders + Campaigns | X | X | all campaigns in the selection |
Info
The dashboard automatically appears when you select a project or a folder.
When you select multiple items (projects, folders, test cases), you must refresh the dashboard by clicking on the button  to display it.
Focus
A selection containing an iteration and another entity (campaign, folder, project) does not generate a dashboard.
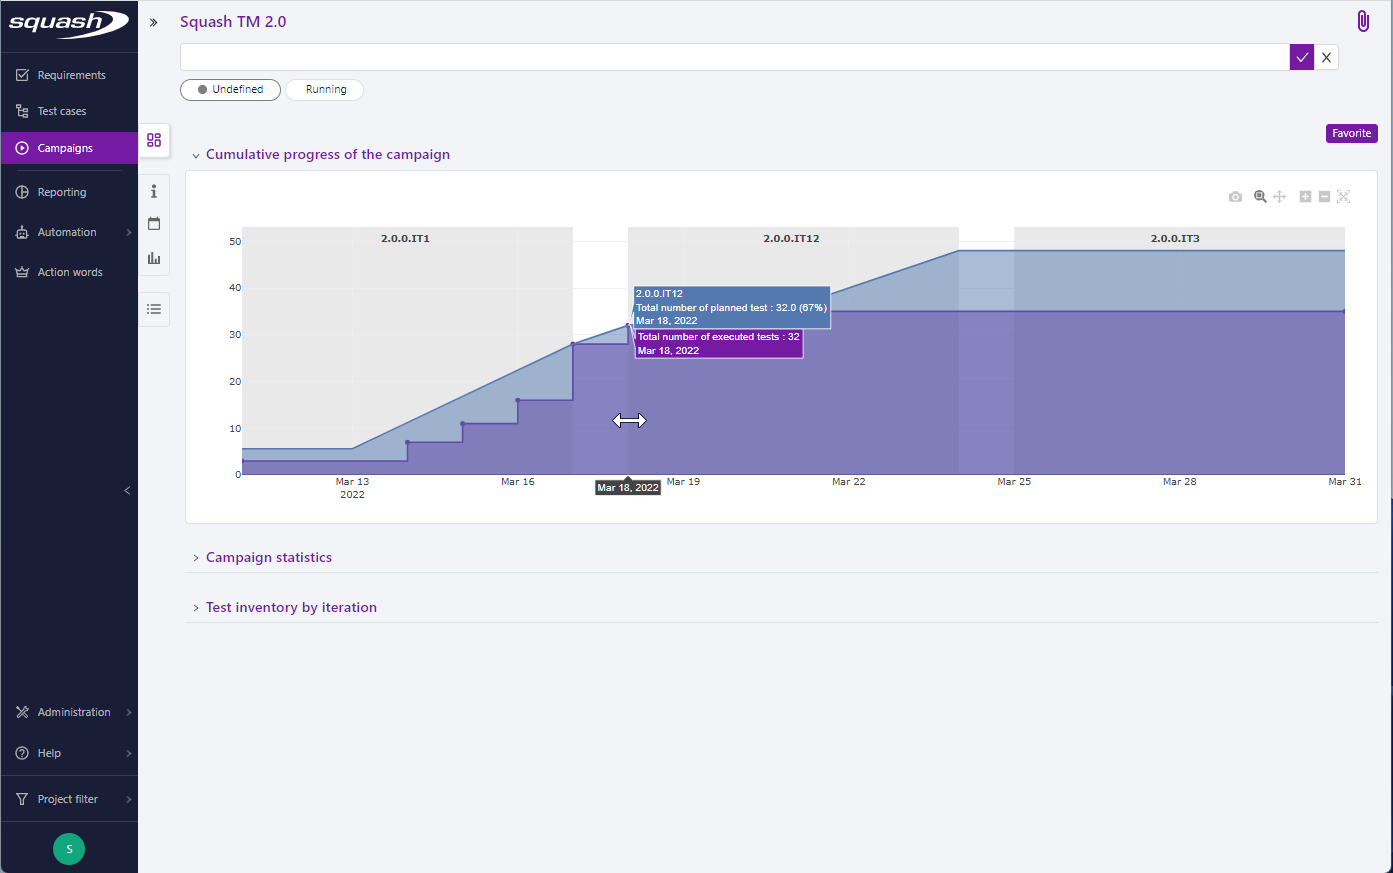
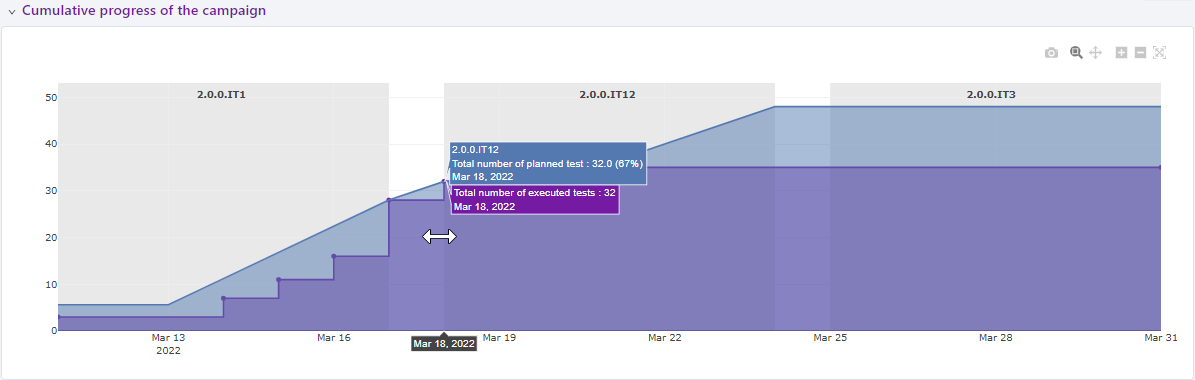
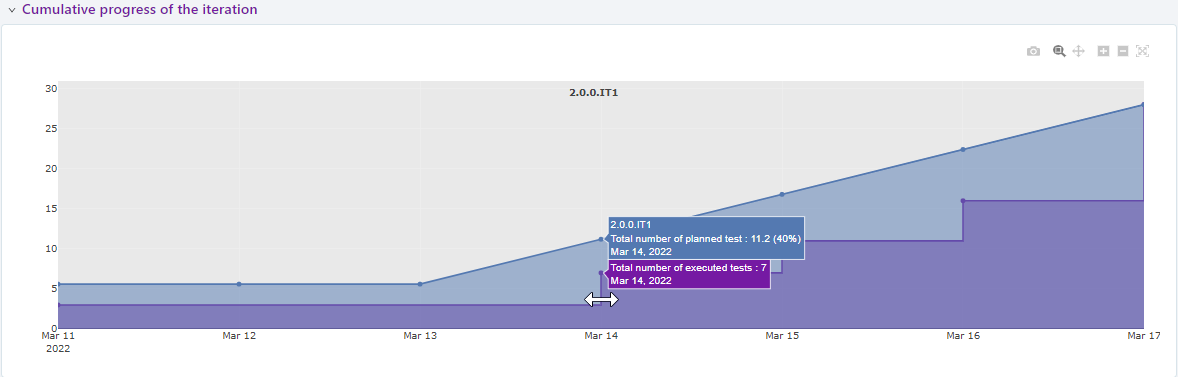
Cumulative progress of the campaign
The Cumulative progress of the campaign graph is generated from the Cumulative progress of the iteration graphs. They are generated automatically from the dates given in the Scheduling block of the iteration. It is a graphical representation of the cumulative progress of the object taking into account the dates of the campaign, the iterations and the number of test cases to be done. The graph proposes a representation allowing to compare the achieved (purple curve) and the planned (blue curve) and thus to evaluate the cumulative progress of the campaign or the iteration.
Focus
The dates of two iterations must not overlap for the Cumulative progress of the campaign to be generated.
The scope of the cumulative progress of a campaign is all the iterations that the campaign contains.
The scope of the cumulative progress of an iteration is all items in its execution plan.
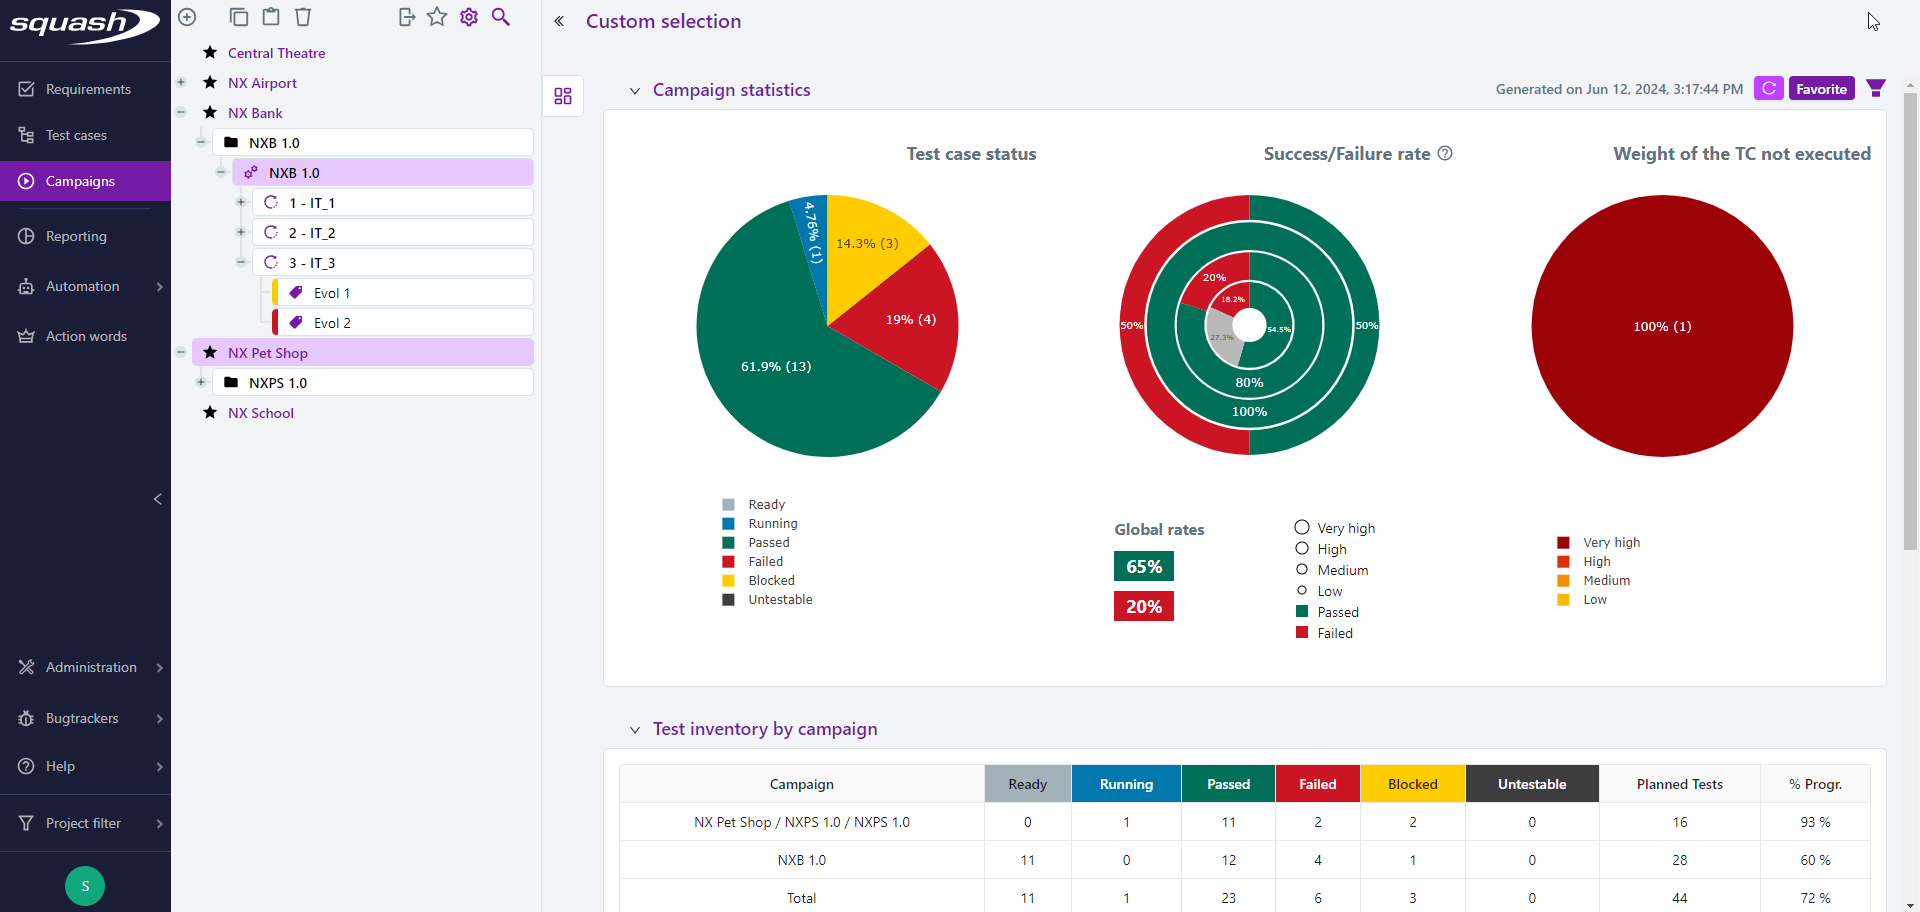
Campaign statistics
The graphs in the Campaign statistics block show the distribution of tests by execution status, the success or failure rate by importance of tests and the distribution by importance of tests never executed.
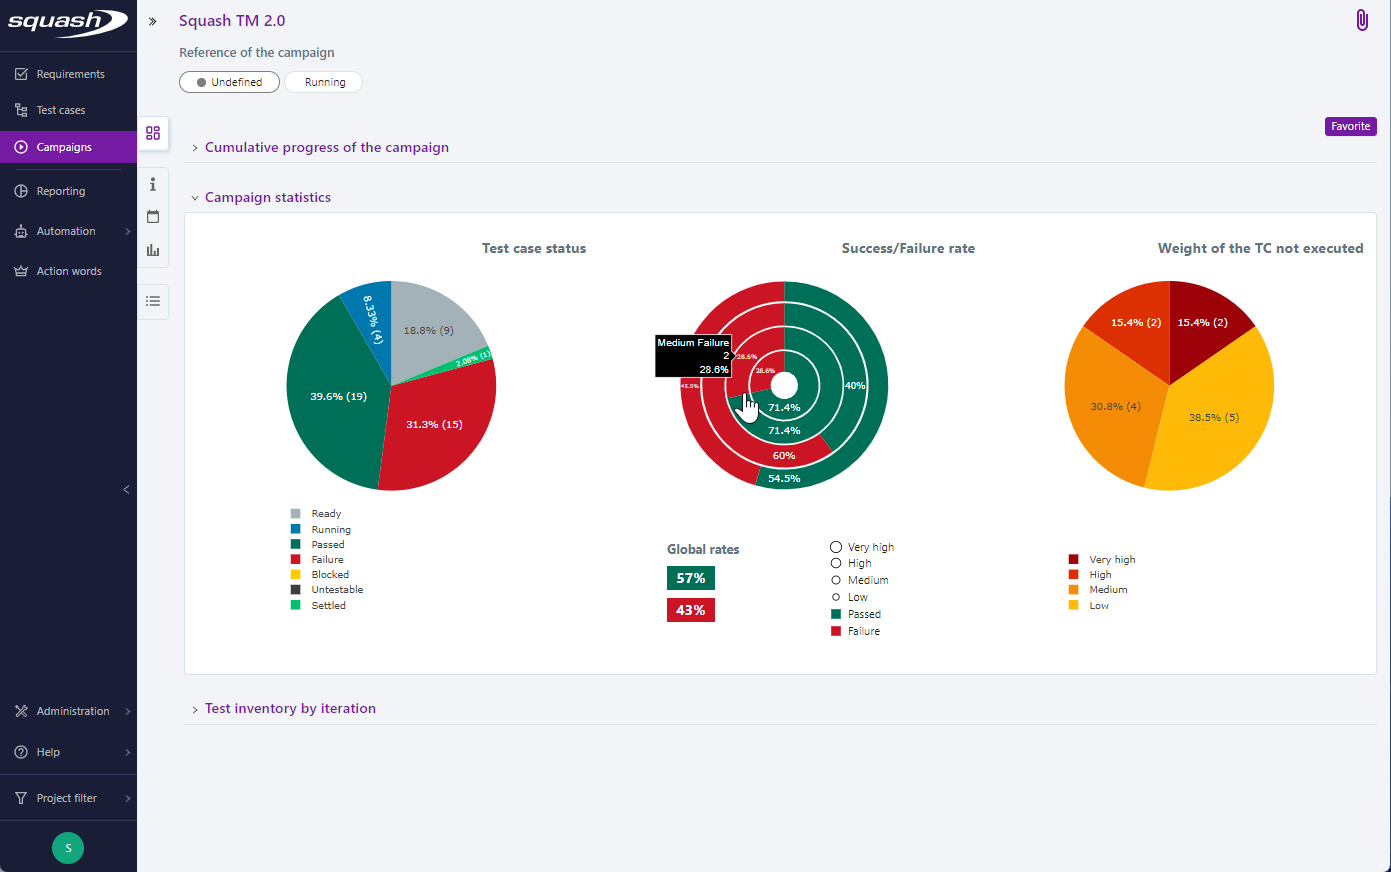
In these charts, the option Only display statistics for the latest execution allows you to visualize either:
- all the test plan items within the scope (unchecked option): for example, in a campaign with two iterations, if the same test case fails in iteration 1 and passes in iteration 2, it will be counted twice in the charts;
- only the last test plan item corresponding to a test case - dataset pair (checked option): taking the above example, only the successful test from iteration 2 will be counted in the charts

Accessing the Search Page
When clicking on a portion in the Test case status, Success/Failure rate, and Weight of the TC not executed charts, a search page appears with preselected criteria matching that portion of the chart.
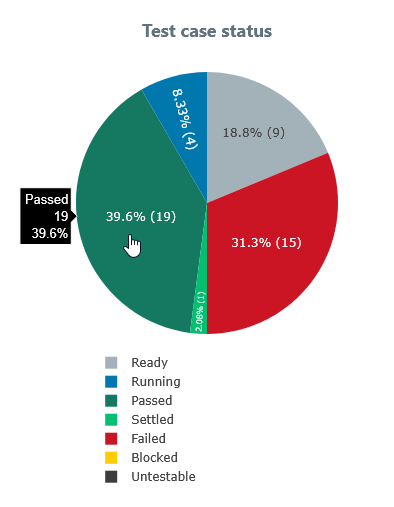
For example:
When clicking on the Passed test cases slice of the Test Case Status chart, a search page appears with the criteria Status: Passed, Passed (+warning).
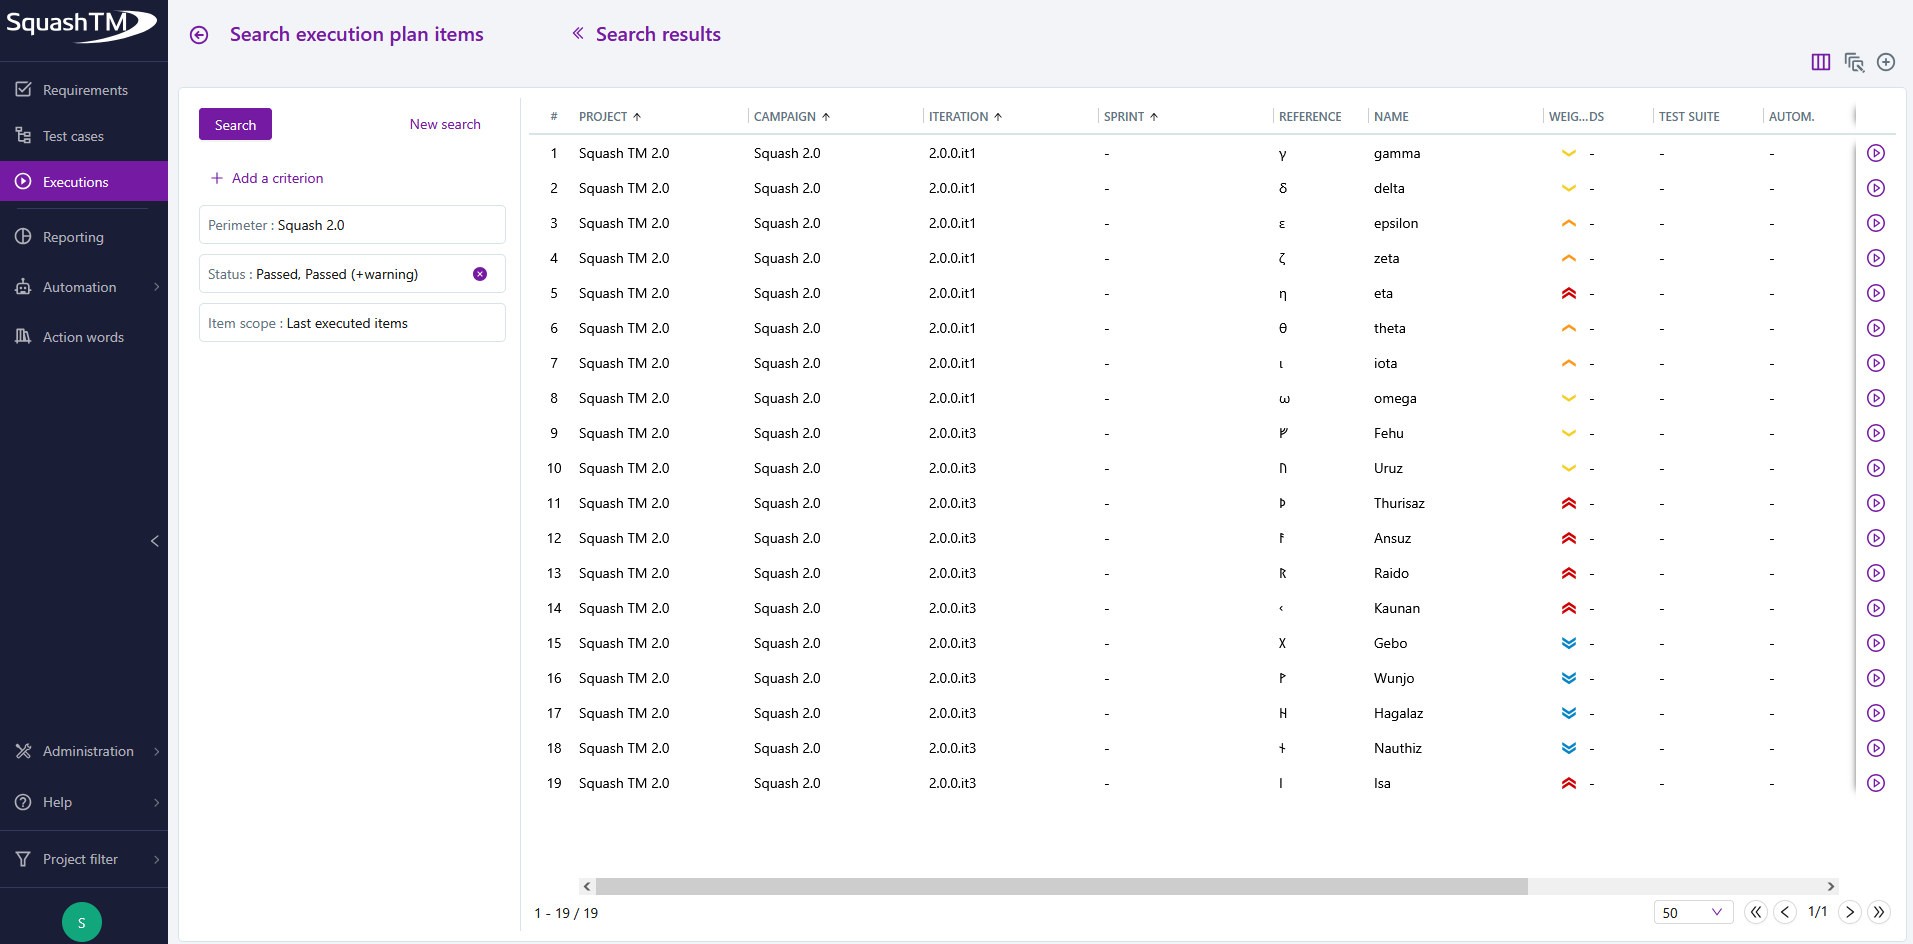
Info
This feature is not available for custom dashboards.
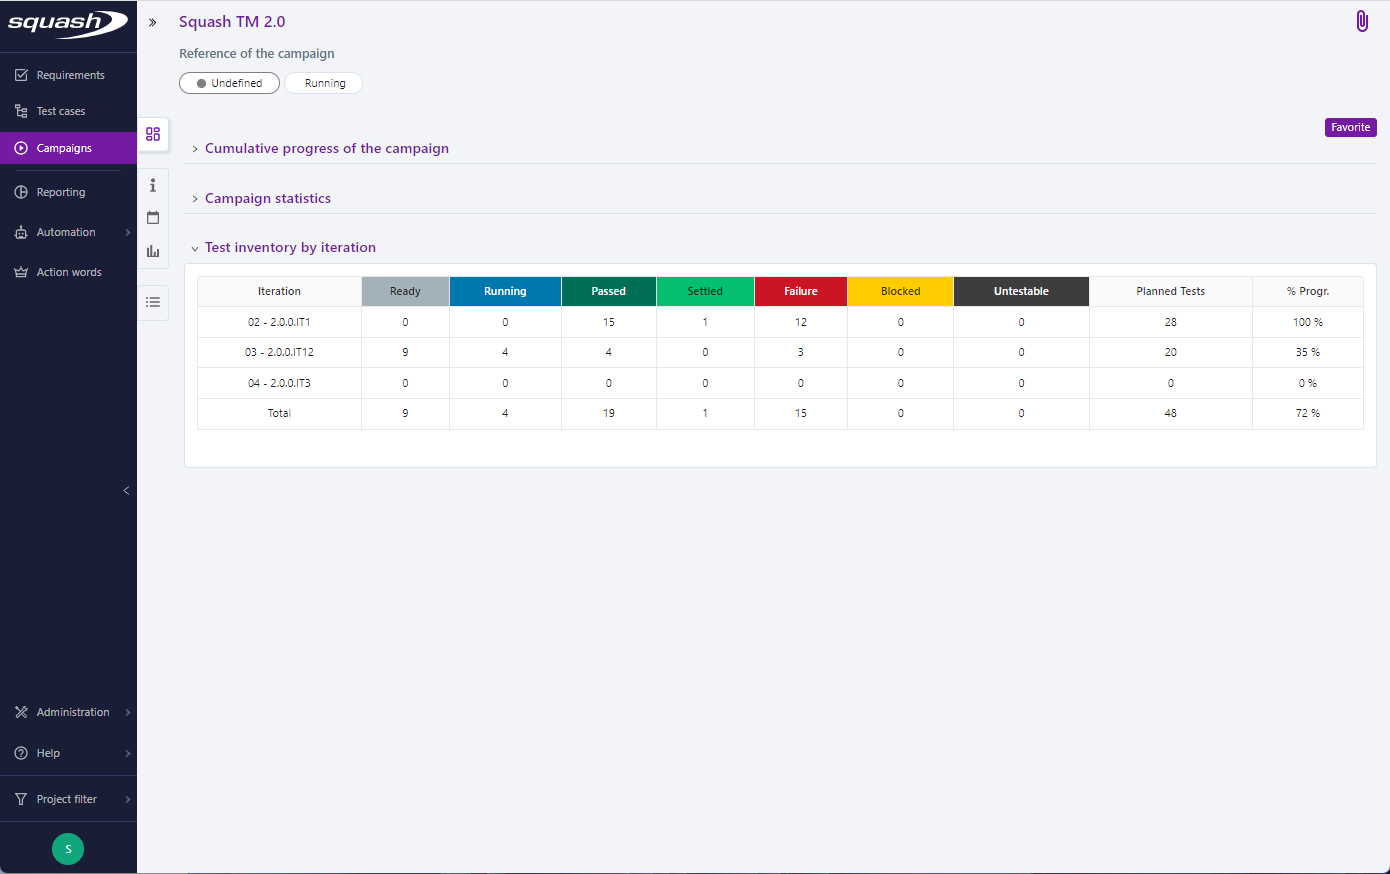
Test inventory
The Test inventory by iteration block of a campaign is a distribution table counting the number of tests by execution status and by iteration.